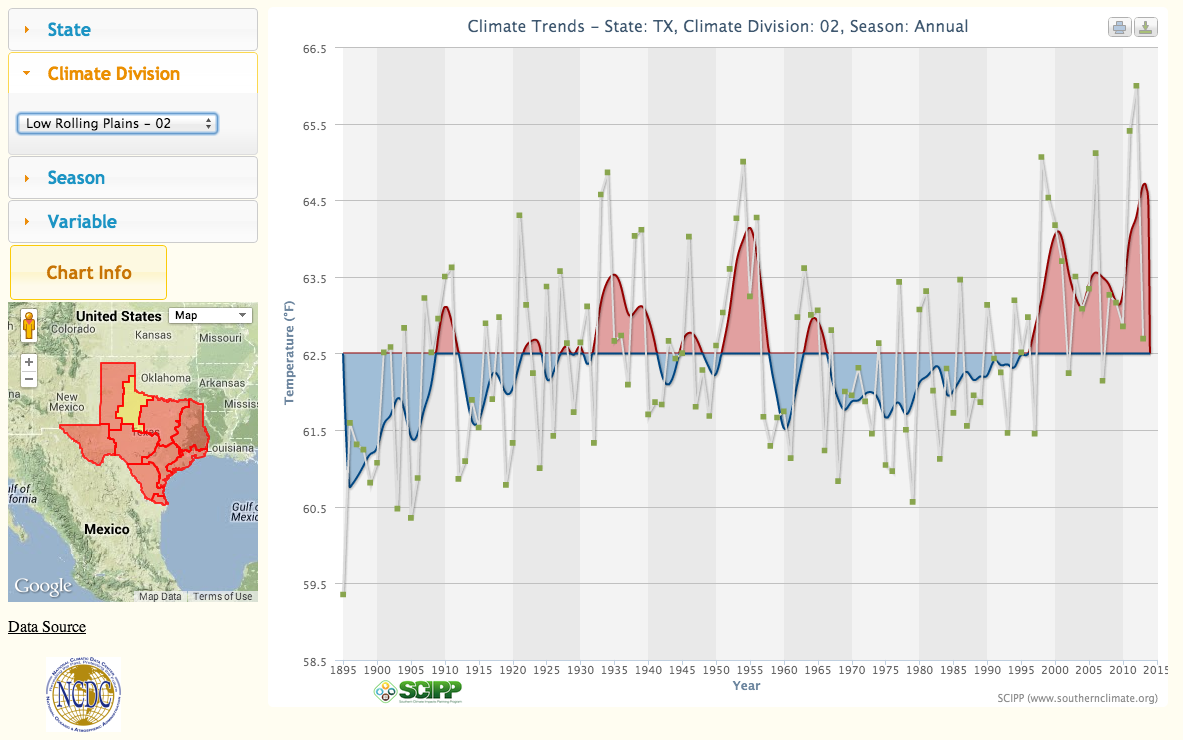
This tool displays precipitation and temperature trends for the period of the instrumental record, 1895-Present. Users can view the long term average (horizontal line), 5-year moving average, and yearly average by climate division and season for any state in the lower 48 states. Data are provided via a graph and a mouse-over function allows the user to view yearly values.