New Publication on Extreme Hourly Precipitation Time Series in the Southeastern United States

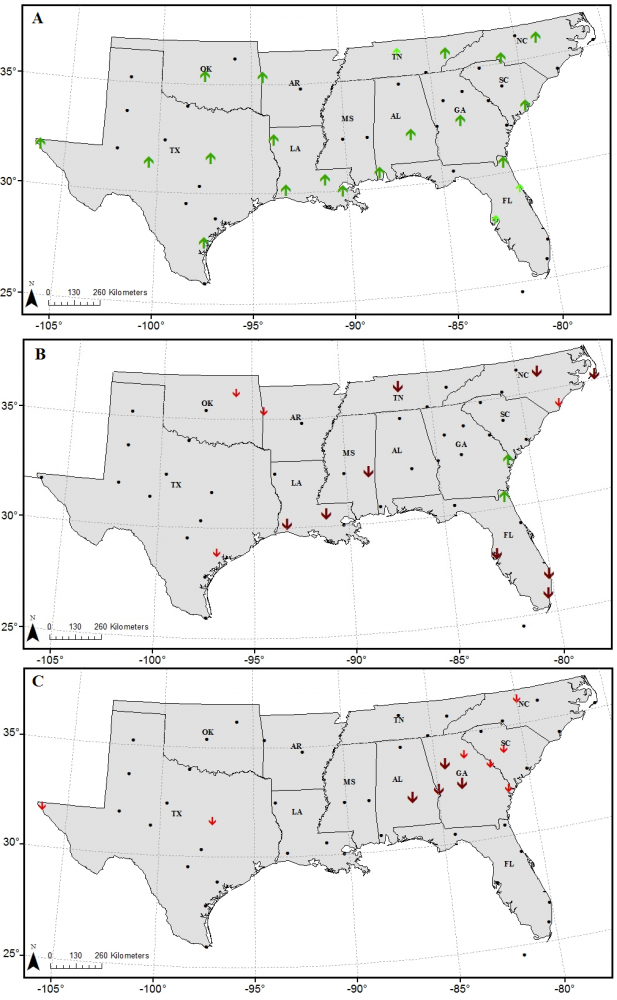
SCIPP researchers at LSU, Dr. Vincent Brown and Dr. Barry Keim, along with Dr. Alan Black at Southern Illinois University at Edwardsville, recently published “Trend Analysis of Multiple Extreme Hourly Precipitation Time Series in the Southeastern United States” in the Journal of Applied Meteorology and Climatology. The research complements a previous manuscript published by the same authors titled “Climatology and Trends in Hourly Precipitation for the Southeast United States” (Journal of Hydrometeorology in August 2019) and highlights changes in extreme hourly precipitation time series. During the study period (1960-2017), the annual magnitude of the greatest 1-, 3-, 6-, 12-, and 18- hourly periods did not show many spatially congruent or significant trends, revealing that the single biggest annual hourly precipitation events did not change in magnitude in the region across the 50 weather stations that were analyzed. However, the magnitude of annual hourly 90th percentile events did show increasing trends significant at 36% of the sites analyzed, shown in the figure below. This demonstrates that while the single biggest events in a year did not change, hourly magnitudes of lesser, yet still heavy, events are increasing at some stations in the Southeast United States. The study also highlights changes in the longest hourly precipitation events and dry spell durations in the region.

Trends (1960–2017) in annual (a) 90th percentile value, (b) average dry spell duration, and (c) maximum wet period. Darker-green arrows represent increasing trends that are significant at the p ≤ 0.05 level; smaller lighter-green arrows represent increasing trends that are significant at the 0.05 ≤ p ≤ 0.10 level. Large darker-red arrows represent decreasing trends that are significant at the p ≤ 0.05 level; smaller red arrows represent decreasing trends at the 0.05 ≤ p ≤ 0.10 level. Black dots represent insignificant stations. Source: Brown et al. (2020).
Trends (1960–2017) in annual (A) 90th percentile value, (B) average dry spell duration, and (C) maximum wet period. Darker-green arrows represent increasing trends that are significant at the p ≤ 0.05 level; smaller lighter-green arrows represent increasing trends that are significant at the 0.05 ≤ p ≤ 0.10 level. Large darker-red arrows represent decreasing trends that are significant at the p ≤ 0.05 level; smaller red arrows represent decreasing trends at the 0.05 ≤ p ≤ 0.10 level. Black dots represent insignificant stations. Source: Brown, V. M., Keim, B. D., & Black, A. W. (2020). Trend Analysis of Multiple Extreme Hourly Precipitation Time Series in the Southeastern United States, Journal of Applied Meteorology and Climatology, 59(3), 436. © American Meteorological Society. Used with permission.
Scroll to Top