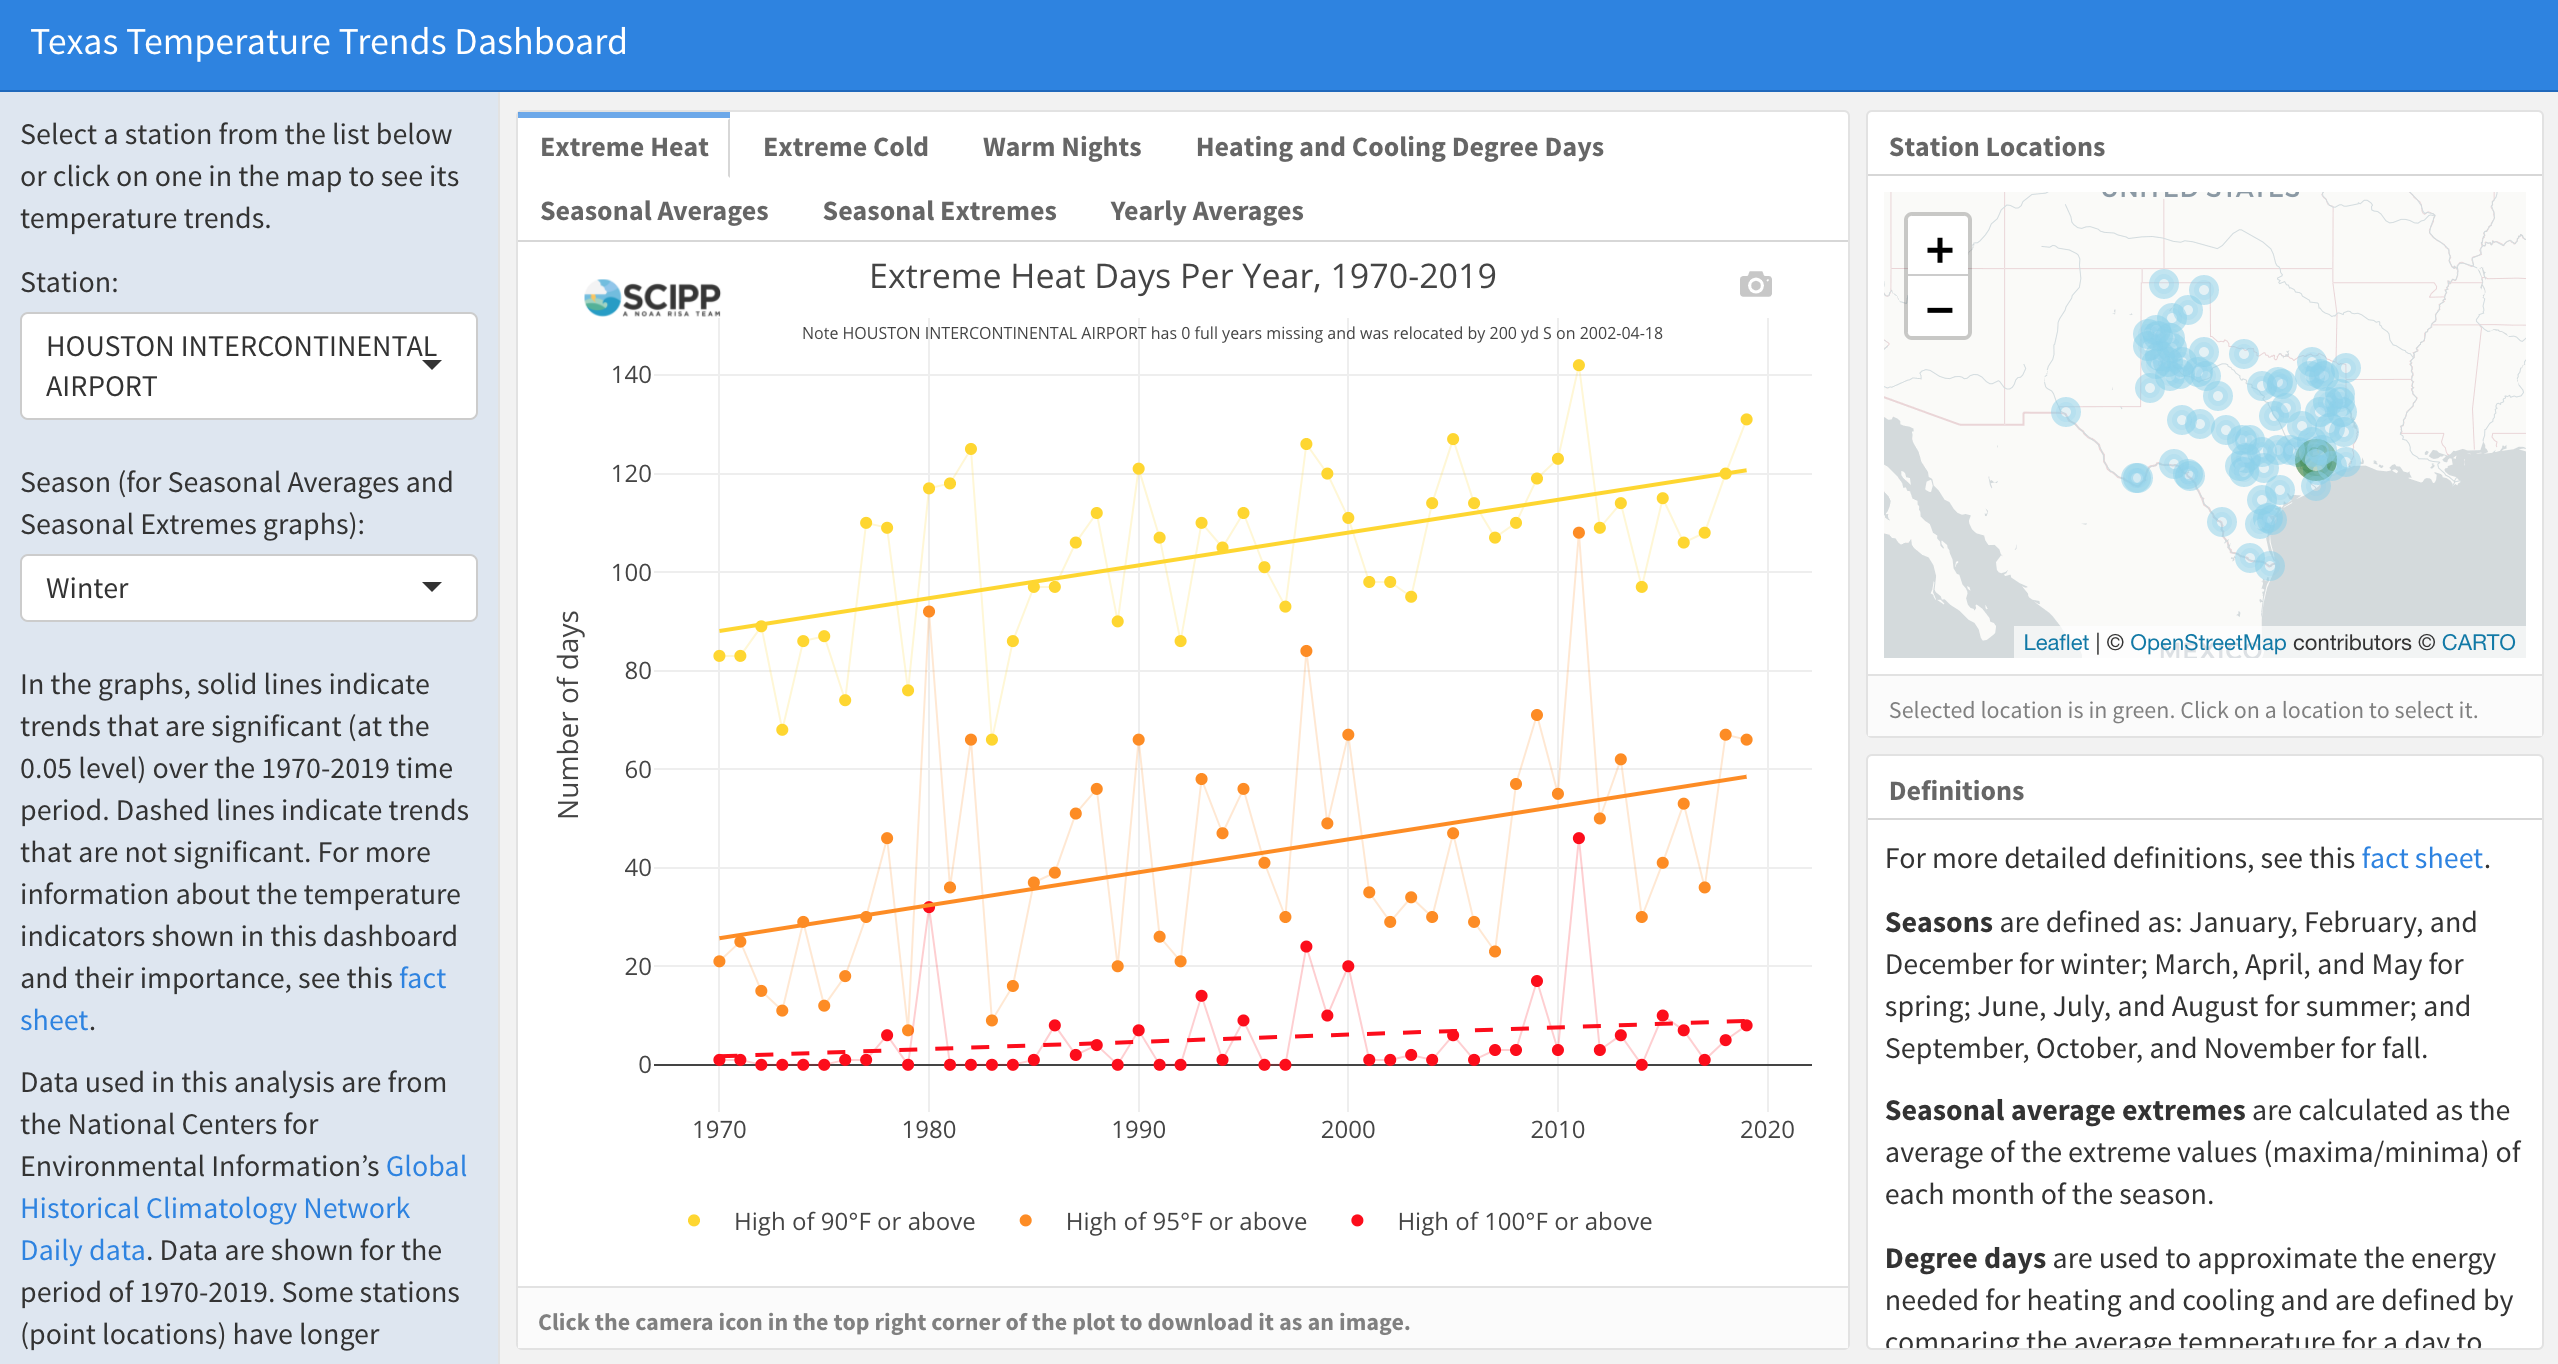
SCIPP Research Associate Simone Speizer, in collaboration with Texas Sea Grant, has created a tool that shows historical trends in temperatures for locations across the state of Texas. The Texas Temperature Trends Dashboard presents trends in extreme heat, extreme cold, warm nights, heating and cooling degree days, seasonal average temperatures, seasonal extreme temperatures, and yearly average temperatures from 1970-2019 for 75 stations (point locations) in Texas. The graphs show both individual data points for each year and overall trend lines, and they can be downloaded as images. The dashboard also includes a link to a fact sheet discussing the temperature indicators shown in the tool and their importance.
While other resources exist that present regional or national trends in temperatures, few tools offer such information on a local level. This dashboard helps to fill that gap by providing location-specific information about changes in temperature in the last 50 years. By incorporating trends in indicators such as extreme heat and warm nights to data of overall temperature trends, the dashboard delivers insight into changes in heat that can bring public health and economic ramifications to communities. Other indicators, such as heating and cooling degree days, are relevant to analyses of energy use and emissions.
Access the dashboard directly here or through the Data Tools page.