Cold Extremes
Data Limitations
Arkansas generally has good quality long-term data records for cold temperature values, however, the consistency of cumulative years on record vary by station. The majority of stations consist of a large record dating back up to the 19th century, however, some station locations include gaps in records that could be subject to technical issues or changes in monitoring location.
Definition and Description
A cold wave is generally characterized by a sharp and significant drop of air temperature near the surface (maximum, minimum, and daily average) over a large area and persisting below certain thresholds for a localized minimum number of days (WMO 2016).
Note: There is no universally-recognized metric for what constitutes a cold extreme. The World Meteorological Organization recommends characterizing a cold wave by its magnitude, duration, severity, and extent. Magnitude is defined as a temperature drop below certain threshold(s), either as an absolute value or percentiles. These values must be determined by the local climatology.
Cold extremes occur when polar and arctic air is displaced from polar regions toward the equator. The lack of sunlight in polar regions during winter allows the buildup of cold, dense air. Wiggles in the jet stream allow equator-ward (southward in the Northern Hemisphere) transport of cold air into the continental United States. High-amplitude jet-stream patterns (a series of large troughs and ridges in the upper atmosphere around the globe) allow air masses to move from their source regions.
Historical Data
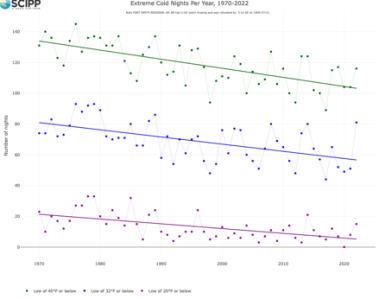
Temperature Trends Dashboard
(1970-2023)Southern Climate Impacts Planning ProgramThis tool shows temperature trends at individual stations across Arkansas, including trends in extremely cold nights, seasonal extreme and average high/low temperatures, and heating degree days, since 1970.
1. At the top of the tool, click the Extreme Cold, Heating and Cooling Degree Days, Seasonal Averages, or Seasonal Extremes tab. 2. The default station is in Abilene, TX. To choose a station nearest to you, use the map on the right. Zoom in and click any of the blue dots to change stations. You can also select a station under the Station dropdown menu on the left of the page 3. Use the graph to determine the trend (if any) for your selection. Solid lines represent significant trends. 4. Mouse over individual data points to view more information. 5. For seasonal selections, make sure Winter is selected in the Season drop-down menu on the left of the screen.
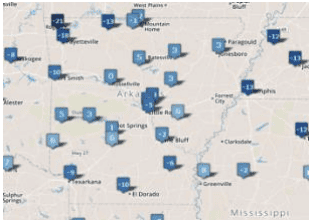
Record Low Temperatures
(Period of record varies by station; up to ~140 years) Southern Regional Climate CenterThe SRCC’s Climate Extremes Tool displays the lowest temperature ever recorded at individual stations.
1. Under Product, select All-Time Records. 2. Under Variable, select Low Min Temperature. 3. Click Submit. 4. Temperature record is displayed on the map (pan, zoom-in or -out if needed). Mouse over station to determine its period of record and day on which the record occurred.
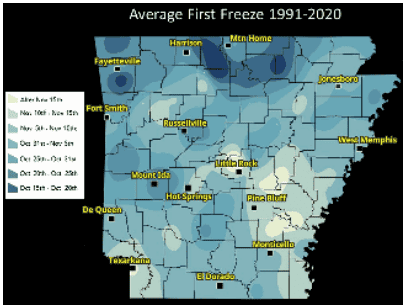
Average Freeze Dates
(1991-2020)National Weather Service-Little Rock, ARThis static map shows the average date of the first freeze (Fall) across Arkansas. A link to a map of the average date of the last freeze (Spring) is located below the map. The maps can be used to understand the times of the year in which you might experience temperatures below freezing for your area.
1. Scroll to middle of page to view the maps. 2. Click on map of interest from the following: First Freeze (Fall) or Last Freeze (Spring). 3. You can also obtain frost and freeze information for individual stations by scrolling down the page a bit and clicking on the drop-down menu, then Get Info!
Wind Chill Days and Hours
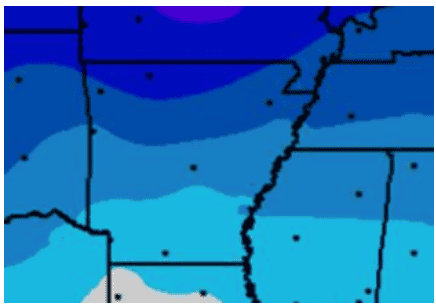
(1973-2023) Midwest Regional Climate CenterThis set of maps depict the average number of days, day with 3 or more hours, and average number of hours per year with wind chill values at or below a variety of thresholds (e.g., 15°F, 0°F, -10°F).
1. Near the top of the page, click on the map link of interest out of the three options: Average Number of Days, Days with 3 or More Hours, or Average Number of Hours. Right above the map, mouse over the wind chill temperature value of interest to view the corresponding data on the map. 3. To interpret the colors, see the legend on the top-right side of the map. 4. To view more detailed information, such as station data, click the GIS Maps button on the top right of the page.
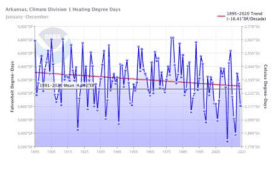
Average Annual Heating Degree Days
(1895-present)NOAA National Centers for Environmental InformationThis graph shows the average annual heating degree days (HDD) and trend over time, a measurement used to quantify the demand for energy needed to heat buildings.
1. Within the Parameter drop-down menu, choose Heating Degree Days. 2. Within Time Scale, choose Annual. 3. Within Start Year, choose desired start year. 4. Within State, choose Arkansas. 5. Within Climate Division, choose desired region of interest. 6. Under Options box, check Display Base Period and select 1991 and 2020 to show the most recent 30-year trend. 7. Check Display Trend, select per Decade, 1895, and present year to show the longterm trend and decadal change. 8. Click Plot button. Note: A few seconds are required to generate the graph.
Climate Change Trends
According to Vose et al. (2017), Arkansas’s average temperature has not changed much overall the past 120 years, and the southern half of the state has cooled slightly. However, its coldest temperature of the year has warmed by about 2 to 6°F. Climate change is projected to decrease the frequency and intensity of cold waves (Vose et al. 2017), and by mid-century, Arkansas is projected to experience 15 to 25 fewer days below 32°F, with a greater reduction of up to 30 fewer days across the northwest portion of the state. Warmer winters signify that the cold season will shorten, which will subsequently lead to a longer frost-free period and growing season. Extreme cold events will continue to impact Arkansas; however, they will occur less frequently and with less intensity (Vose et al. 2017). Read more about future cold extremes in Climate Change Science and Projection Resources.
Climate Explorer – Climate Maps and Graphs Tools
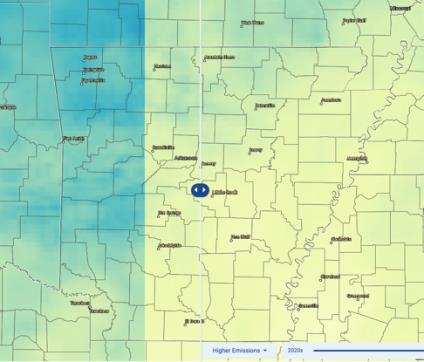
(1950-2099)NOAA Climate Program Office and National Environmental Modeling and Analysis CenterThe Climate Explorer is an interactive tool that allows you to view and compare the annual heating degree days and the average number of days per year with a maximum or minimum temperature below 32°F for the historical period and in the future under both higher and lower emissions scenarios.
1. Type in the city or parish you are interested in. 2. Click Climate Maps. 3. Using the drop-down menu in the upper-left corner, select the variable of interest (Days w/ max temp <32°F, Days w/ min temp <32°F, or Heating Degree Days). 4. Next to the drop-down menu, select Map. 5. Use the middle slider on the map to compare averages between the historical period (1961-1990) and future decades (2020s-2090s) under lower and higher emissions scenarios. (Use the bottom drop-down menus to choose variables and the slider on the bottom right to choose a decade to compare with.) On the map, zoom in to the parish level and click a parish to view the associated values. 6. To view this information over time (1950-2099) for a single location, click the Graph tab at the top of the map and type a location at the top.