Severe Thunderstorm Winds
Data Limitations
Population and temporal biases (i.e., greater number of reports in recent decades), a limited number of weather stations that record wind speed, and the fact
that severe thunderstorm winds can be very localized, mean that data are not of sufficient quality to robustly determine whether there have been trends over a long period of time (e.g., 100+ years).
Definition and Description
High winds are defined as sustained non-convective wind speeds of 40 mph or greater lasting for 1 hour or longer, or gusts of 58 mph or greater for any duration.
Severe thunderstorm winds are winds of 58 mph or greater when convection (i.e., thunderstorm) is present.
High winds can occur with thunderstorms, but also with frontal passages and gradients between areas of high and low pressure. There are several types of wind events.
- Straight-line winds are thunderstorm winds that do not have rotation and are different from tornadic winds.
- Downdraft winds can also be damaging and are a small column of air that rapidly sinks toward the ground.
- Downbursts describe wind events that are caused by a strong downdraft within a thunderstorm.
- Microbursts are small concentrated downbursts that produce an outward burst of strong winds at or near the surface.
Wind speeds and the effects can be measured by the Beaufort Wind Scale (NWS 2024), which ranges from 0 (calm winds) to 12 (hurricane-force winds).
Historical Data
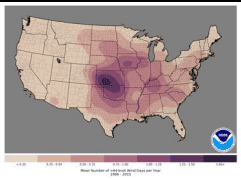
Severe T-Storm Wind Days Per Year
(1986-2015) NOAA/National Weather Service Storm Prediction CenterThis map shows you the average number of days per year in which severe thunderstorm wind reports were received in your area. The map gives you a sense of the approximate number of days each year that you can expect to see severe thunderstorm winds (57 mph or greater) in your area.
1. Click on the link below to go to the website. 2. Select any of the three wind climatology maps to view a larger image: Greater Than 50 Knots & Less Than 64 Knots, Greater Than 64 Knots, or All Wind Greater Than 50-Knots. Note: 50 knots is equal to 57 mph; 64 knots is equal to 73 mph.
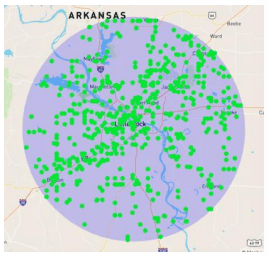
Severe T-Storm Wind Reports
Wind: (1955-Present)Southern Regional Climate CenterThis interactive tool shows you the historical record for individual severe thunderstorm wind reports (gust of 57 mph or greater) in your area. It can be used to determine severe thunderstorm wind events that have impacted your area or close to your area.
1. On left side of screen, click on Search within Radius. 2. Choose the diameter of the area of which you want to investigate (25 or 50 miles). 3. Select Wind (de-select Torn and Hail). 4. Pan, zoom, and then click on the map area of interest. 5. Reports are displayed on the map and in two tables below the map. 6. Map: Mouse over individual storm reports for details. 7. Tables: There are two tables, Recent Storm Reports and Historical Storm Reports. Click on column header to sort by column of interest. For example, to view the dates in which the highest wind occurred, click on the Scale column headers to sort by the highest wind value.
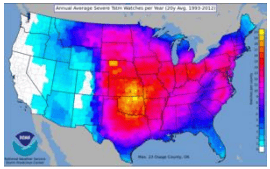
Severe T-Storm Watch Climatology Map
(2004-2023)NOAA/National Weather Service Storm Prediction CenterThis map shows you a 20-year climatology of severe thunderstorm watches. From this map you can get a sense of the approximate number of days each year you can expect to have a severe thunderstorm watch issued for your county(ies).
1. Under the Storm Prediction Center WCM Page banner near the top of the page, click on the Watch Frequency Maps link. 2. Scroll down a bit until you see 20y SPC Watch Climatology. 3. Click on the average number of severe thunderstorm watches per year image to view it in larger form. Note: this WCM page contains a lot of other statistics about the hail, severe thunderstorm and tornado products that come out of the NWS Storm Prediction Center if you are interested in digging deeper into data.
Climate Change Trends
Damaging winds in Arkansas are associated with severe thunderstorms. More favorable environments for severe thunderstorms are expected and increases in
severe wind occurrences are projected. Climate models project an increase in the frequency and intensity of severe thunderstorms in the United States. Uncertainty
remains, however, in the assumption that the favorable environments will reach their potential of producing damaging winds (Kossin et al. 2017).