Winter Storm (Ice, Sleet, Snow)
Data Limitations
Ice storm/freezing rain data are very limited due to the complexity of observational accounts (e.g., rain, freezing rain, and snow can occur at a single station
during a single event).
Definition and Description
A winter storm is a winter weather event that produces impactful accumulations of freezing rain (ice), sleet, and/or snow (NWS 2018).
Winter storms may include heavy snowfall, blowing and drifting snow, high winds, extreme cold, or ice storms. Among the greatest hazards associated with winter storms are traffic accidents. The most extreme instance is a blizzard, which is defined as winds greater than 35 mph, visibility less than ¼ mile, lasting at least 3 hours. New snowfall is not necessary for a blizzard, and blowing snow can similarly obscure visibility.
Winter storms are measured by snowfall accumulation or ice thickness. Winter storms occur in Arkansas between November and March and are usually created by large low-pressure systems moving rapidly across the country. In Arkansas, ice storms are a greater threat than blizzards. Access to moisture from the Gulf of Mexico falling over shallow cold air near the surface can produce ice accumulations of two inches or greater with tremendous damage to power distribution.
Historical Data
Snowfall Climatology Toolbox
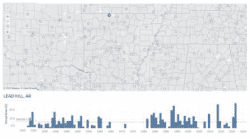
(Period of record varies by station; ~30- 140 years) Midwestern Regional Climate CenterThis interactive tool shows normal (1991-2020) annual and monthly snowfall, average annual number of days with snow totals at certain thresholds, average first and last snow date, and record 1-day snowfall. The map displays normal values while the graph below it shows the variable by year.
1. Position map to area of interest or choose AR in the State Selection drop-down menu on the right. 2. On the top of the screen, select a variable you’re interested in (e.g., Annual Snowfall). Some variables have options on the right side of the screen to select, such as a month to display for monthly snowfall or a snow threshold. 3. For most variables, the map displays the normal/average value for the variable you selected. For Record 1-Day Snowfall, it shows the record value at each point. The legend for the colored points is on the top-right side of the screen. 4. The graph below the map shows more details, such as the values per year instead of an average. Note: The map default shows stations with data from at least 1991- 2020. If you’d like to see longer time frames, you can move the slider under the Data Available Since option on the right. When you select a different start year, it will only show stations with available data.
Snowfall Extremes
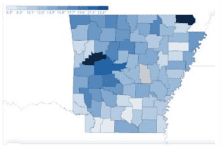
(Period of record varies by location; up to ~140 years) NOAA National Centers for Environmental InformationThis interactive static map shows the 1-Day, 2-Day, and 3-Day snowfall maximums by county.
1. Select the day(s) of interest on the top right side of the map. 2. Mouse over county of interest for information on the maximum snowfall event on record. 3. A table below the map shows location (by county and station), date of event, and snowfall total details.
The Frequency of Freezing Rain
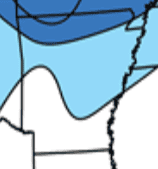
(days: 1948-2000; hours: 1932-2001)Midwest Regional Climate CenterThis page includes information about ice storms, including frequency maps of the average annual number of days and hours with freezing rain. Other resources and information, such as preparedness actions, are provided as well.
1. Under the webpage’s heading, click the Frequency tab or scroll down until you reach the section The Frequency of Freezing Rain. 2. View the top map for the average annual number of days with freezing rain from 1948-2000 or the bottom map for the annual average number of hours with freezing rain from 1932-2001. Note: These maps were derived from the journal articles Changnon and Karl (2003) and Changnon (2004). Changnon and Karl (2003) is an open access article and can be found here for further information.
Long-Duration Freezing Rain Events
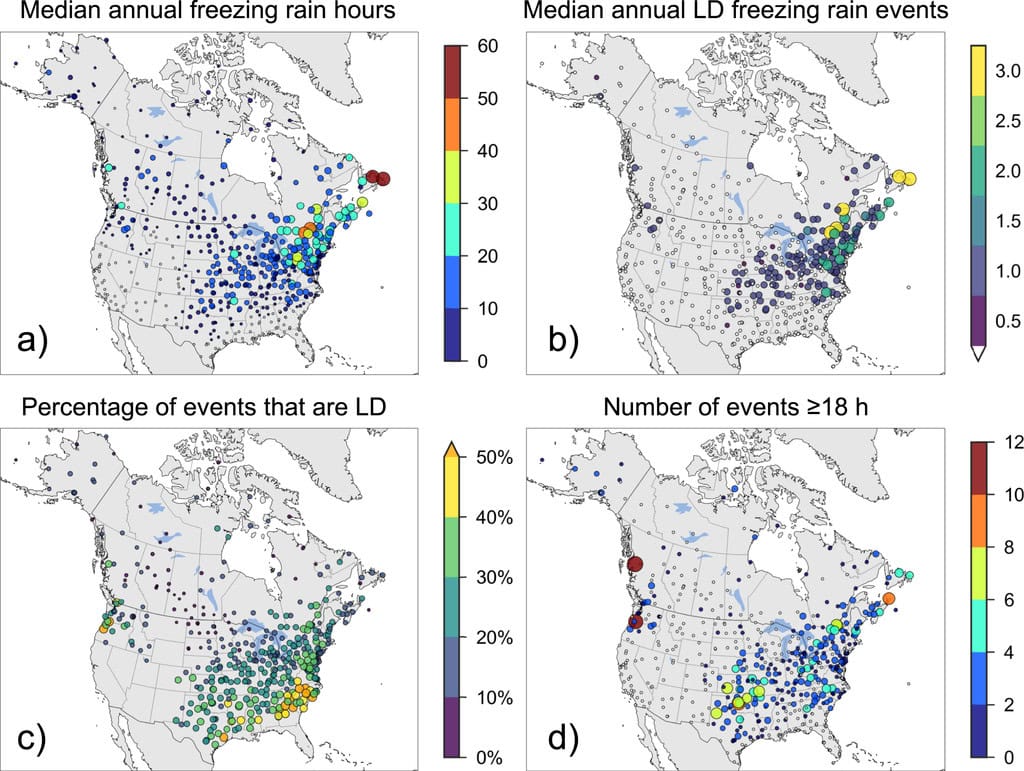
(1979-2016)McCray et al. (2019), open accessThis is a figure within a scientific journal article. While the article includes complex scientific information about the meteorological processes behind ice storms, the analysis in Figure 1 shows a climatology of freezing rain and long-duration freezing rain events from 1979-2016 at stations across North America.
1. Scroll down to Figure 1, located in section 3. Regional climatology of long-duration freezing rain. 2. Click View Full Size under Figure 1 to enlarge the image. 3. There are 4 maps, including a) median annual freezing rain hours, b) median annual LD (long-duration) freezing rain events, c) percentage of events that are LD (long-duration), and d) number of freezing rain events lasting at least 18 hours from 1979-2016. 4. Each dot on the map represents a weather station. You can view the station closest to your area or read below for a summary of the state.
Figure summary for Arkansas: In map A, we see that Arkansas experiences up to 30 hours of freezing rain per year. Map B indicates that many stations across Arkansas have one long-duration freezing rain event (or an event lasting more than 6 hours) per year. Map C displays that up to 50% of freezing rain events in Arkansas have a long duration. This varies by station, as seen by the range of colors. Yellow and green colors represent the 30-50% range. Finally, map D indicates that most stations in Arkansas experienced 2-4 freezing rain events that lasted at least 18 hours from 1979-2016, with one station is northwest Arkansas had 4-6 events. Events of this duration are considered in the 99th percentile, which is a rarity. Overall, this figure shows that Arkansas is typically affected by long-duration freezing rain event each year, some of which have been exceptionally long lasting since 1979. This impacts travel, energy, infrastructure, and health.
Climate Change Trends
Years consisting of a large number of snowfall days declined across the southern United States between 1930 and 2007 (Easterling et al. 2017). Models suggest that although the number of snowfall events will likely continue to decrease given overall atmospheric warming, when snow does occur, accumulations will be greater due to increases in atmospheric moisture (Krasting et al. 2013). There is significant uncertainty surrounding the future of ice storms in Arkansas. Observational data limitations and the complexity of the events themselves make it difficult to determine with much specificity whether patterns have and/or will change. Models show that by mid-century there will generally be a northward shift of the rain, sleet, and snow dividing line across the central and eastern United States. This shift will add to the complexity of determining precipitation type for winter events (rain, ice or snow) in Arkansas, however, the increase in atmospheric moisture may bring an increase to the amount of precipitation that does fall (Easterling et al. 2017).