Heavy Rainfall and Flooding
Data Limitations
There is a relatively long historical record of precipitation data. However, there can be gaps between station locations, so some rainfall events, including high rainfall amounts, may not be adequately represented in the data. Also, flood risk depends on a precipitation event, preceding events, the built environment, and flood mitigation techniques. Flooding can and does occur outside of the Federal Emergency Management Agency (FEMA) Special Flood Hazard Areas. Flood impacts are often extremely localized, so the data listed below may not adequately represent a single community or neighborhood flood risk or history.
Definition and Description
Heavy rainfall is rain with a rate of accumulation exceeding a specific value that is geographically dependent (AMS 2012). Flooding is any high flow, overflow, or inundation by water which causes or threatens damage (NWS 2009).
Heavy rainfall is a subjective term, but is rain falling at a rate more than the underlying surface can handle, causing runoff, inundation of low-lying areas, and flooding. This may include short-duration thunderstorms lasting a few hours or rainfall accumulating over several days. Flooding is the result of heavy rainfall but also the underlying surface. The rate of infiltration (how quickly it is absorbed by the soil), how quickly runoff reaches the creeks and rivers, if there had been prior rainfall, if the ground is frozen, and other local factors affect runoff and flooding. Consequently, a rainfall of a given rate and amount may cause flooding in one circumstance but not in another. Flooding is most likely in low-lying areas, along the edges of water bodies (ponds, lakes, rivers), and over impermeable surfaces (such as streets and parking lots). Primary causes include slow-moving thunderstorms and storms that track over a location in rapid succession, or tropical systems. Flash flooding may occur with intense thunderstorms while river flooding usually requires rainfall accumulated over a longer duration.
Rainfall accumulations may be compared against previous occurrences through the concept of “return-period values”. This is a statistical assessment of the frequency with which similar amounts have been recorded in the past at a specific location. These return periods, such as 1 in 25 years (a 4% chance of occurring in any given year), are not predictive tools – a large event occurring in the recent record does not prevent another similar or larger event occurring shortly after. Also, if heavy rainfall has already occurred, stormwater retention systems may be filled to capacity allowing a smaller event to cause flooding impacts similar to a much larger event. Rainfall rates and accumulations are usually greatest during the spring, summer, and fall, when warm air can hold more water vapor to produce greater rain rates. River flooding is most likely in spring or fall, when fronts may stall giving a focus for thunderstorm development. Tropical systems, either from the Gulf of Mexico or from the Pacific Ocean, can produce among the highest rainfall rates in the state.
Historical Data
Climate Extremes Tool – Precipitation
(Period of record varies by station; up to ~130 years) Southern Regional Climate CenterThis interactive map shows daily precipitation extremes at airport weather stations, which can be used to show some previous heavy rainfall occurrences (i.e., the highest rainfall totals do not necessarily occur at airport weather stations).
1. Pan and zoom to the location of interest. 2. To obtain High precipitation records by month: On the left side of the screen, select Records For A Month → High Precipitation → Month of interest → Submit. 3. The measurement unit is inches. Mouse over the icon on the map for record details (date of occurrence and station record). 4. To obtain All-time records: Select All-Time Records → High Precipitation → Submit.

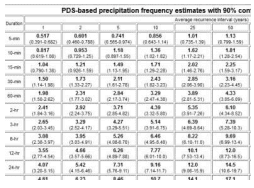
NOAA Atlas 14 Precipitation Frequency Data Server
(Last updated in 2013) NOAA Hydrometeorological Design Studies CenterThis interactive tool shows rainfall frequency estimates for select durations (e.g., 3-, 12-, and 24-hours) and recurrence intervals (e.g., 100-, 500-, and 1000-years) with 90% confidence intervals. Probable maximum precipitation (PMP) values are not represented in this tool.
1. Click on Louisiana from the map. A new tab will open. 2. To select a location, either enter the desired location, station, or address manually OR double-click the interactive map. 3. Precipitation frequency estimates will be displayed in both table and graph forms below. 4. For additional help, select FAQ from the left-hand menu, then refer to the Section 5 link under section 1.1.
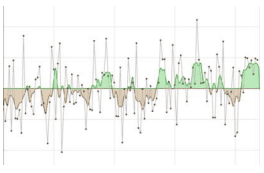
Historical Climate Trends Tool
(1895-present)Southern Climate Impacts Planning ProgramThis tool shows precipitation trends by state and climate division, annually, seasonally, and monthly. Years, seasons, or months with high precipitation totals may be indicative as years with flood events during one or more parts of the year, however, this must be correlated with other data.
1. On the left side of the screen, select Louisiana. 2. Select the climate division of interest or the entire state. 3. Select annual, season, or month of interest. 4. Select Precipitation. 5. For more information on how to interpret the chart, click on Chart Info on the bottom left and hover over points to view individual precipitation values.
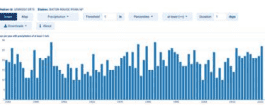
Climate Explorer – Historical Thresholds Tool
(Period of record varies by station; up to ~130 years) NOAA Climate Program Office and National Environmental Modeling and Analysis CenterThe Climate Explorer is an interactive tool that allows you to view the number of extreme rainfall events per year for a station’s period of record, among many other features.
1. Type in the city or county you are interested in. 2. Click Historical Thresholds. 3. From the top menu, select a Threshold in inches (e.g., 1 in). 4. Select a duration Window in days (e.g., 1 day). 5. Choose a station (red dot) on the map. 6. The resulting plot displays a bar chart with days per year (or multi-day duration you chose) with precipitation reaching your selected threshold. Hover your mouse over the bars to view yearly information.
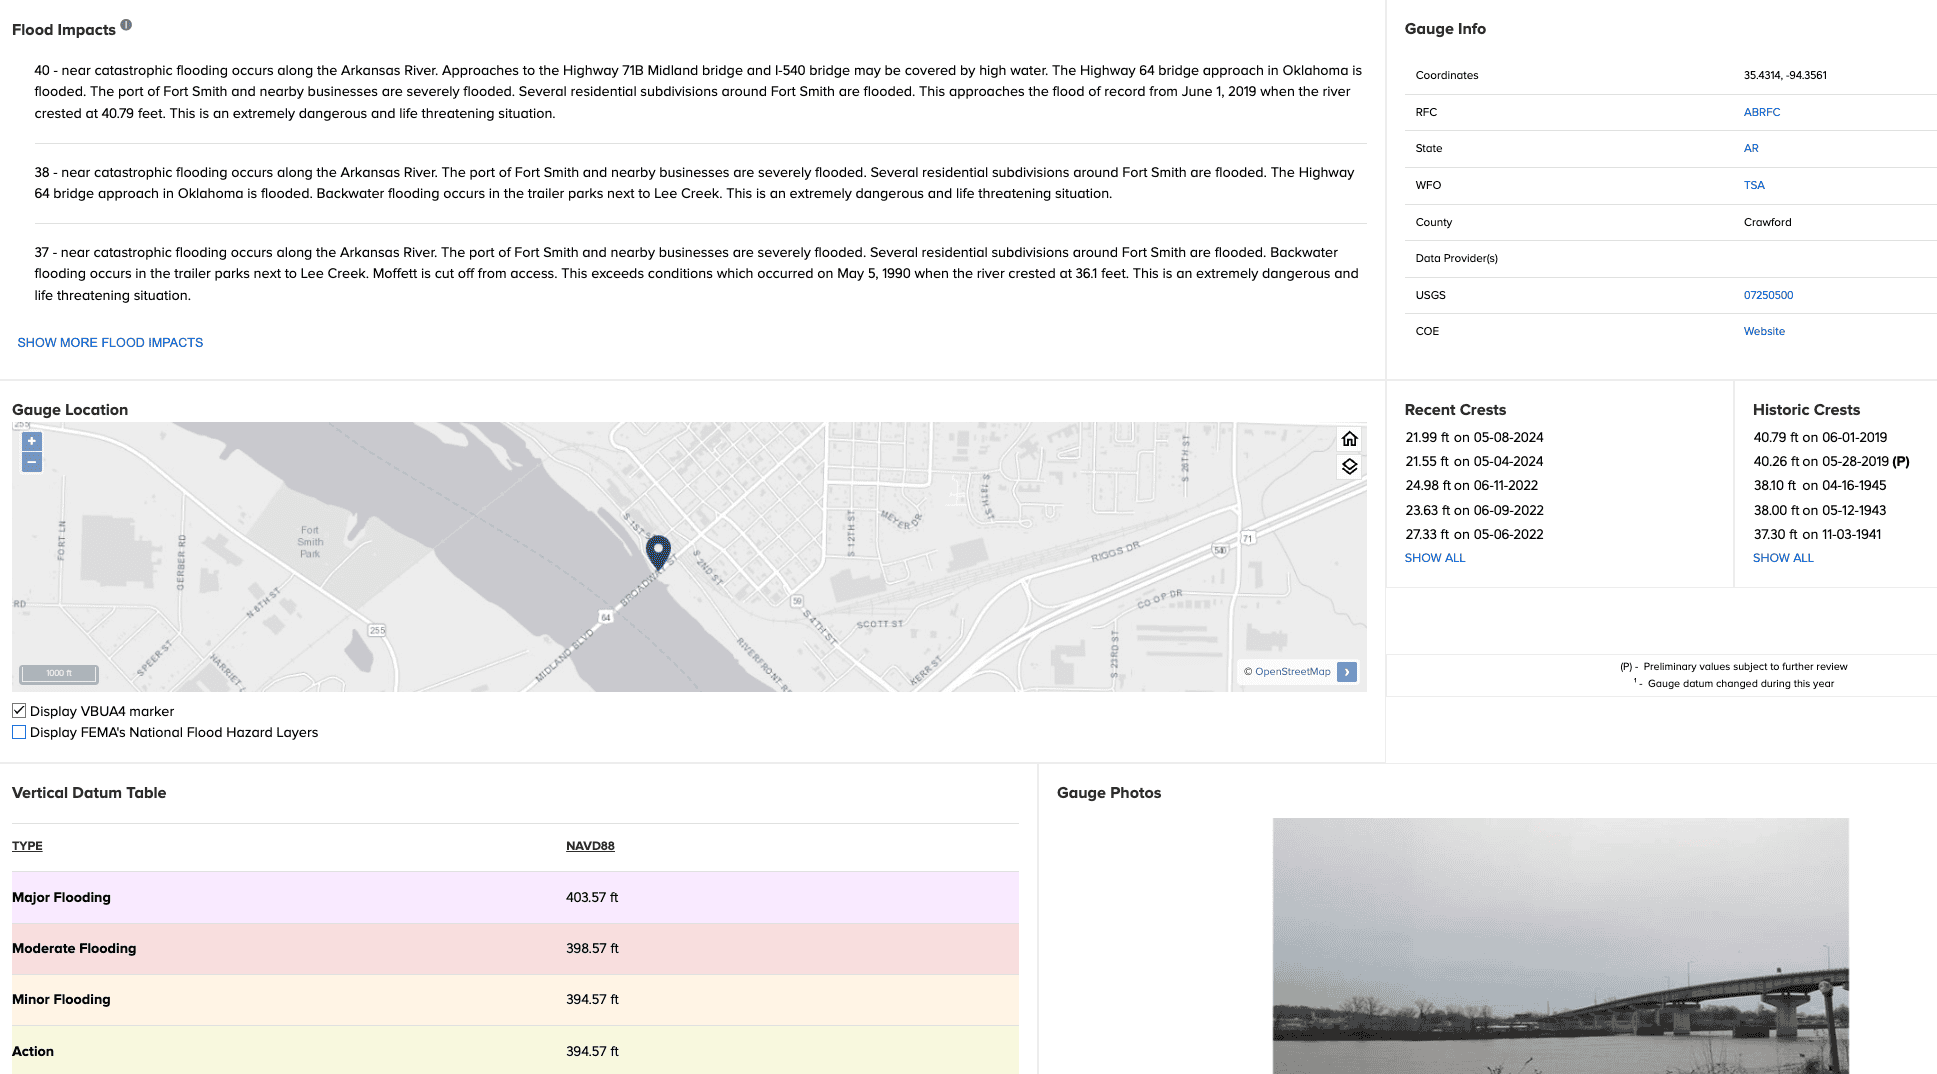
Flood Impacts by River Crest Height
(Period of record varies by gauge; up to ~110+ years)NOAA National Weather ServiceThis interactive tool shows a summary of flood impacts and historical gauge information for locations of interest. It can be used to identify historic and recent river crest heights, flood impacts by crest height and location, and hydrographs.
1. On the map, pan and zoom to the area of interest. Click on the stream gauge of interest on the map. 2. A new side window will pop up with the selected gauge’s information. Click Full Information at the top. 3. A hydrograph with recent and forecasted values is shown at the top. Below this is a table with flood stages and associated crest heights. To view Flood Impacts for a range of crest heights, scroll down the page. Click Show More Flood Impacts to expand this list. 4. Recent Crests and Historic Crests are listed below and to the right. These lists show the crest height and date of the observation. 5. Below this is the Vertical Datum Table with associated flood stages.
FEMA Flood Map Service Center
Federal Emergency Management AgencyThis website can locate and identify flood hazard zones in a jurisdiction and produce maps for use in a hazard mitigation plan. Combined with other map layers, it can provide a spatial relationship between flood hazard zones and critical facilities and infrastructure. Note that the 100-yr floodplain is an estimate used for insurance and regulatory purposes. Floods can and do occur outside of the areas depicted. Note: This tool is a little more involved than some of the others and it is helpful to use a larger computer screen because of the amount of data shown.
1. Enter an address, place, or coordinates in the search bar. 2. Click Search. 3. Click Streets view in upper right corner. 4. The panel of land outlined in light blue is what will be mapped. If you need another panel, click on the one of interest. (Zoom out if needed. It may take a few seconds.) 5. Zoom in to view details. Note the legend below the map and effective date in bold above the map. 6. To download a black and white static image of full original FIRM panel, click on the Map Image icon. To access a colored map, click on the Dynamic Map icon. You may need to disable your browser’s pop-up blocker.
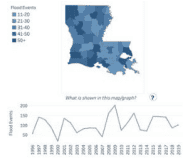
Historical Flood Risk and Costs
(1996-2019) Federal Emergency Management AgencyThis map visualization and graph shows state and parish flood events that are documented in NOAA’s Storm Events Database. It shows the number of flood events by parish and costs of flooding based on average National Flood Insurance Program and FEMA’s Individual and Household Program payments.
1. Under Choose a State, select Louisiana. 2. Louisiana statistics will be displayed on the page. 3. If you wish to view statistics by parish, click on a parish on the map.
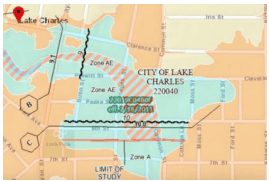
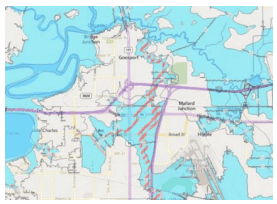
Louisiana FloodMaps Portal: The Base Flood – on the map
LSU AgCenter, LA Dept. of Transportation & DevelopmentThis tool provides information about flood risk at a particular location and shows how FEMA’s Flood Insurance Rate Maps (FIRM) have changed over time.
1. Click Continue. 2. Enter an address/coordinate or select a parish from the drop-down menu. Note: if you select a parish, the page may bring you back to the welcome page. If so, just click Continue again, then click the X to exit the location pop-up menu on the mapping page. 3. The map shows the Effective FIRM, floodway areas, and other layers. 4. Click the Layers button on the top right to select various FIRM layers and ABFE (Advisory Base Flood Elevation; if available). Click the question mark next to any layer to read more. 5. Click the Legend button on the top right to interpret all map features. 6. Zoom in and click on the map for point-specific information. On the resulting pop-up box, click Community Info or What Does This Mean? to learn more. Note: Click the “i” on the top right of the screen for additional guidance.
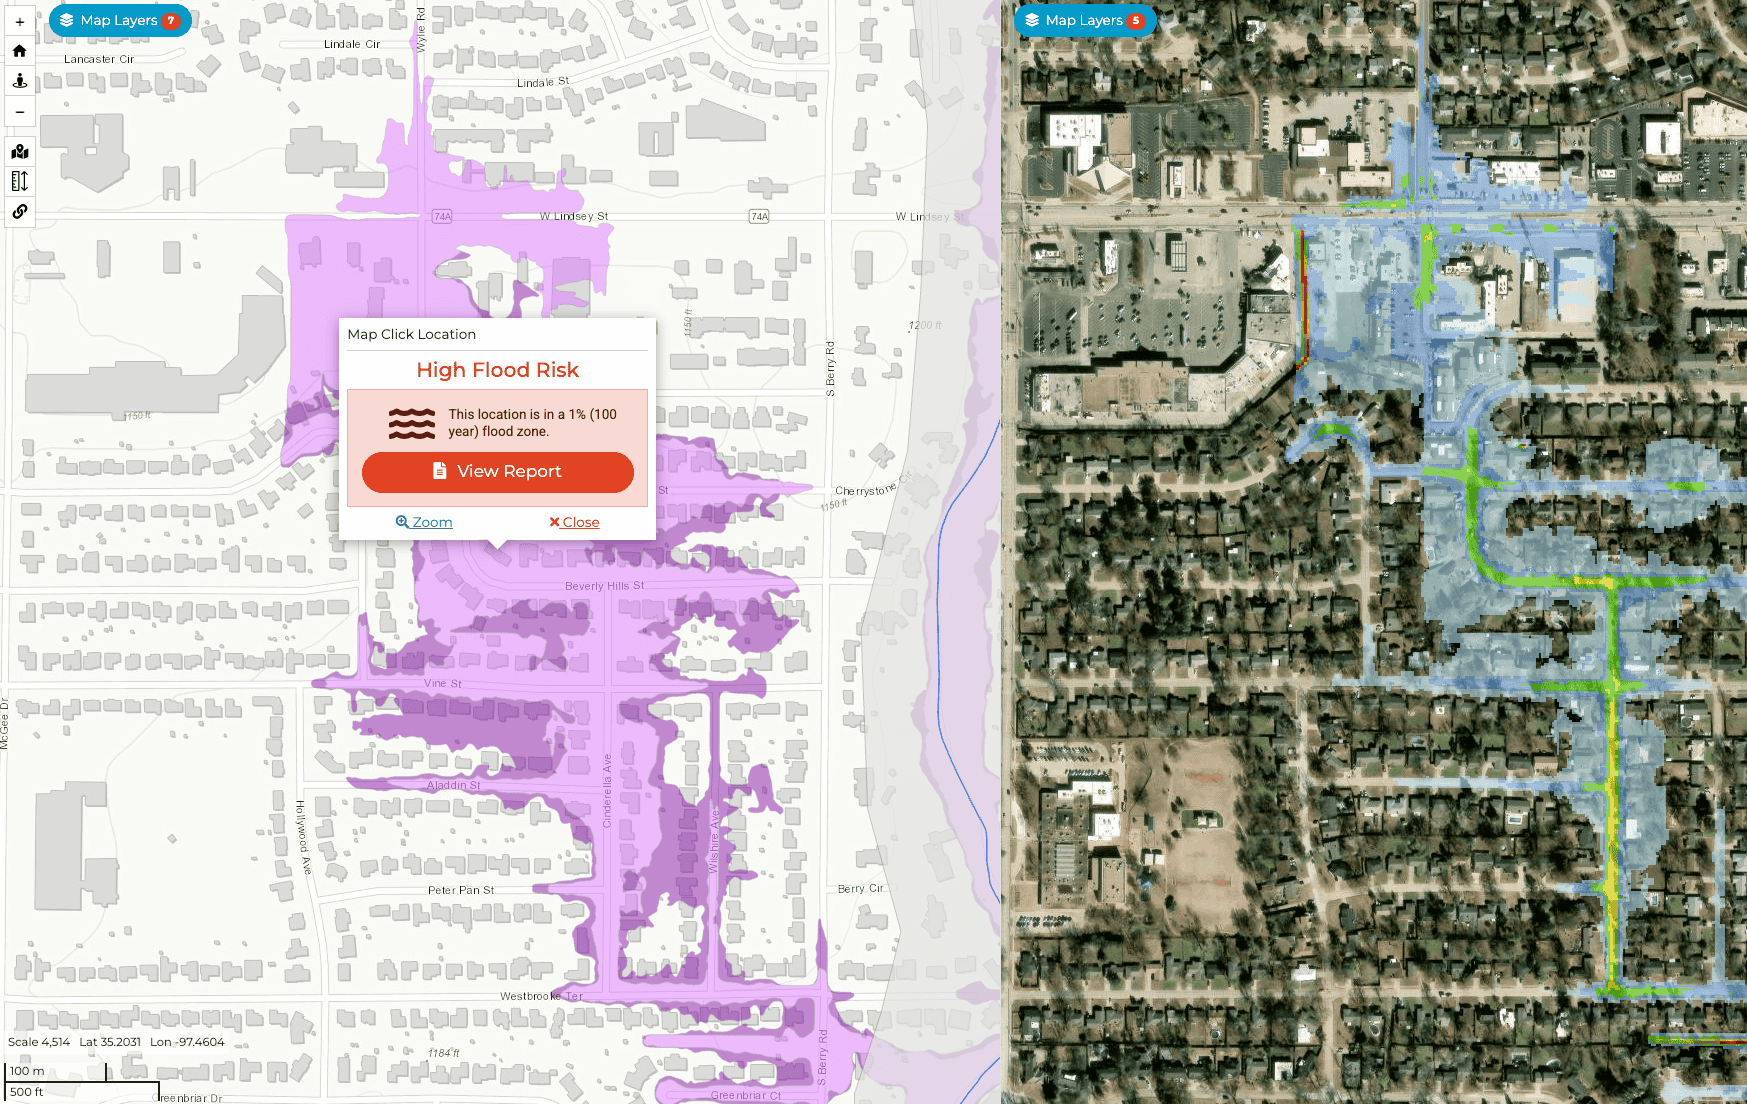
FEMA's Estimated Base Flood Elevation Viewer
Federal Emergency Management AgencyThis tool shows Base Level Engineering datasets, models, maps, and reports that allow users to visualize and download flood risk data for their community and give property owners site-specific flood risk information. This helps them understand the possible risk to their homes and businesses and make informed decisions to reduce damage from future floods.
1. In the Select an Area of Interest drop-down menu, select FEMA Region 6. 2. On the next screen, select What’s My Flood Risk? to view a local report with estimated base flood elevation (BFE). 3. A panel of two maps is on the next page: 1% (100-year) and 0.2% (500-year) flood extent on the left and flood depth (1%) on the right. To quickly produce a BFE report, follow the options on the left menu under the Report tab to either enter a location of interest, click a location on the map, or use your current location. Note: A report will only generate when BFE data are available at that location. To view where data are available, zoom in on the map and click a property that is in the 1% flood extent area (purple color on the left map; click Legend next to the Report button on the top left to view the legend). If BLE data are unavailable, a pop-up box will notify you when you click a location. If the property is in a study zone (gray area), the tool will direct you to another tool and will not produce a report. 4. After selecting a location, click View Report. A new page shows the 2-page report with estimated flood extent, flood depth, and base flood elevation. The second page includes more information about using the data and taking action.
5. To explore the map, go back to the BFE Viewer tab on your web browser. Click the Legend tab at the top left of the page. 6. On each map, click Map Layers to choose other data to explore. In the Base Level Engineering drop-down menu, you can select other flood extents or depths, as well as other information. You can view only one map at a time by clicking 1 Map View on the top right of the screen.
Climate Change Trends
Total annual precipitation has largely been above average in Louisiana since 1970, and the frequency of 4-inch extreme precipitation events have been above average since 1980 (Frankson et al. 2022). Across Louisiana, the intensity of hourly rainfall has increased over time (Brown et al. 2019). While annual precipitation amounts are not projected to change much, heavy precipitation events may increase in frequency and intensity (Hayhoe et al. 2018). By the end of the century, the heaviest 1% of rainfall events are projected to increase by up to 40% in intensity under a higher emissions scenario in northern Louisiana and up to 20-30% in southern Louisiana (Hayhoe et al. 2018). With the possibility of more intense rainfall from tropical storms and increased sea level rise and subsidence, flooding risks further increase in coastal and low-lying areas of Louisiana. Intense rainfall, including from tropical storms, has already increased by 6-7% compared to a century ago (Hayhoe et al. 2018). Flooding can cause overflow of sewage systems and contaminants of water resources, displacement of communities, disruption of critical services, and more. Read more about future heavy rainfall events in Climate Change Science and Projection Resources.
Risk Factor
(Present risk and 30- year future projections) First Street FoundationThis tool provides information on flood risk and how it is changing. It shows the trend in number of properties at risk, a specific property’s flood risk score, the flood history of an area, and how an area’s flood risk is expected to change.
1. Type in the county, city, or zip code of interest. 2. Click the Flood Factor tab near the top of the page. 3. Scroll down the page to view flood risk information. Note: Many features on this tool are behind a paywall. If you want information for specific homes and businesses or want to dive deeper into the information, then payment is required. However, you can receive the baseline information above for free.
Climate Explorer – Climate Maps and Graphs Tools
(1950-2099) NOAA Climate Program Office and National Environmental Modeling and Analysis CenterThe Climate Explorer is an interactive tool that allows you to view and compare the average number of days with precipitation greater than 1”, 2”, or 3” per year for the historical period and in the future under both higher and lower emissions scenarios.
1. Type in the city or parish you are interested in. 2. Click Climate Maps. 3. From the leftmost drop-down menu, select Days w/ 1” Precipitation (2” and 3” thresholds are also available). 4. Next to the drop-down menu, select Map. 5. Use the middle slider on the map to compare averages between historical, lower, and higher emissions scenarios. (Use the bottom drop-down menus to choose variables and the slider on the bottom right to choose a decade to compare with.) On the map, zoom in to the parish level and click a parish to view the associated values. 6. To view this information over time (1950-2099) for a single location, click the Graph tab at the top of the map and type a location at the top. Note: Precipitation projections have a high range of uncertainty.
Precipitation Projections
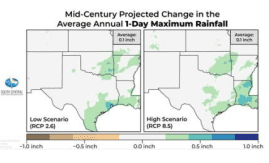
(2036-2099) South Central Climate Adaptation Science CenterThis webpage includes several precipitation projections for the south-central U.S. during the midcentury (2036-2065) and end-of-century (2070-2099) time frames under low and high emissions scenarios.
1. The projections are grouped by mid-century and end-of-century. Scroll down to Projected Change in the Average Annual 1-Day (or 5-Day) Maximum Rainfall for the time frame you’re interested in. 2. The maps in the middle of the page show the projections under a low emissions scenario on the left and high emissions scenario on the right. The average value in the top right of each map represents the average for the entire region, so use the legend below the map to estimate the value for your area. Note: Click the map to view a larger version. 3. On either side of the page is a text summary of the projections for both emissions scenarios. Note: You can use these maps to view the range of projected values, as the future value will likely fall somewhere in between the low and high emissions scenarios.