Hurricane/Tropical Storm/Storm Surge
Data Limitations
Tropical Cyclone (TC) data prior to the satellite era is limited since only land and ship observations were available. This can make it difficult to conclude whether TC activity is increasing or if it is due to better observation systems (Walsh et al. 2015). Similarly, there are gaps in storm surge data with older storms. Storm surge models do not handle leveed areas well, and modeling water levels under levee failure scenarios is complex.
Definition and Description
Hurricane: A tropical cyclone in the Atlantic, Caribbean Sea, Gulf of Mexico, or eastern Pacific, in which the maximum 1-minute sustained surface wind is 64 knots (74 mph) or greater (NWS 2009).
Storm Surge: An abnormal rise in sea level accompanying a hurricane or other intense storm, whose height is the difference between the observed level of the sea surface and the level that would have occurred in the absence of the cyclone. Storm surge is usually estimated by subtracting the normal or astronomic tide from the observed storm tide (NWS 2009).
Hurricane: A hurricane begins as a tropical cyclone, a disturbance that originates over warm ocean waters with organized deep convection and a closed surface wind circulation about a well-defined center. When sustained winds reach 34 knots (39 mph), it is classified as a tropical storm and at sustained winds greater than 64 knots (74 mph) it becomes a hurricane. Each tropical storm or hurricane is given a unique name to track its progress.
Hurricanes need warm ocean waters, an unstable atmosphere, a deep layer of moist air, a pre-existing surface disturbance, and very little vertical wind shear to form. They convert warm, moist air into energy that strengthens the circulation; consequently, when they move over land they weaken quickly. Hurricane season runs from June through December, with a peak around September 10. The Gulf of Mexico peak is usually a few weeks earlier because the shallower water warms faster than the deeper Atlantic Ocean.
Hurricane impacts include winds, storm surge, tornadoes, and inland flooding. Sustained winds over 160 mph with gusts over 200 mph may be recorded in the most intense hurricanes and can extend 30-600 miles away from the storm’s center. Tornadoes are often embedded within the rainbands swirling outward from the center and are most common in the right-front quadrant of the storm. Inland flooding may be caused by several feet of rain over a few days, especially for a slow-moving or stalled hurricane. Hurricane Harvey produced 60 inches of rain over a 5-day period.
Storm Surge: Storm surge is often one of the greatest threats to life and property from a hurricane. Storm surge is a very complex phenomenon because it is sensitive to the slightest changes in storm intensity, forward speed, size (radius of maximum winds), angle of approach to the coast, central pressure (minimal contribution in comparison to the wind), and the shape and characteristics of coastal features such as bays and estuaries. Higher wind speeds from a hurricane lead to increased storm surge. A slower-moving hurricane also leads to higher and broader storm surge inland while a faster-moving hurricane can lead to increased storm surge over open coastal areas. One cause of structural damage from storm surge is the extension of waves further inland that can include water weights of approximately 1,700 pounds per cubic yard. Storm surge can also cause coastal erosion, damaging beaches and coastal roads (NHC 2022a).
Storm surge is observed and measured by NOAA tide stations, FEMA/USGS high water marks, and temporary USGS pressure sensors. NOAA tide stations are a network of continuously operating water level stations throughout the U.S. serving as the foundation for NOAA’s tide prediction products and providing data for storm surge estimates. This data is traditionally the most reliable, but there are limited stations. FEMA/USGS high water marks (HWM) are lines found on trees and other structures marking the highest elevation (peak) of the water surface for a flood event created by foam, seed, or other debris. Survey crews are deployed after a storm to locate and record reliable HWMs. GPS methods are used to determine location for coastal HWMs, which are then mapped relative to a vertical reference datum such as NAVD88. This is traditionally the best method for capturing the highest storm surge level. USGS pressure sensors are temporary water-level and barometric- pressure sensors which provide information about storm surge duration, times of surge arrival/retreat, and maximum depths. These sensors are deployed in advance of an upcoming storm in an area in which the highest surge is expected (NHC 2022b).
Historical Data
Coastal Emergency Risks Assessment
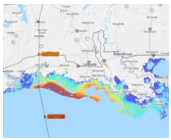
(2012-present) Louisiana State University, Louisiana Sea GrantThis tool allows users to view current, recent, and storm-specific water heights above Mean Sea Level and wind speed. For specific storms, you can also view the storm track and inundation depth above ground. Note: to access all features, you may need to sign up and request a free account.
1. Select a day or storm of interest at the top left. 2. Zoom into the area of interest to view sea level anomalies. 3. Use the options on the right of the screen to choose other variables to view.
National Storm Surge Risk Maps
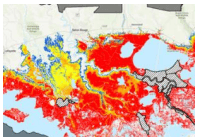
NOAA National Hurricane CenterThis mapper allows users to assess their storm surge risk at various hurricane intensities by displaying the maximum possible storm surge for each storm category. This tool can be used to assist in forming evacuation plans for both individuals and decisions makers.
1. Zoom to the area of interest. 2. Click through the different hurricane categories at the top of the page to view storm surge levels for that area at different hurricane strengths.
SURGEDAT: The World’s Storm Surge Data Center
(Time frame varies by product; up to ~140 years) Southern Climate Impacts Planning ProgramSURGEDAT is an extensive storm surge database for the Gulf of Mexico and East Coast. This site provides access to data and several storm surge tools. The following are active and open to the public:
Live Storm Updates and Archive: http://surge.climate.lsu.edu/
This page allows the user to choose a tropical storm/hurricane of interest and view the associated storm surge levels, sea level pressure, and wind speed and direction.
1. Select the current storm or click the archive link and select a past storm of interest. 2. A new page will open with a graph of storm surge levels at different station locations over the duration of the event and a map of the storm path and gauge locations. 3. Hover over the storm path on the map to view the wind speed and direction, moving speed, and pressure for points along the path of the storm.
Global Peak Surge Map: http://surge.climate.lsu.edu/data.html#GlobalMap
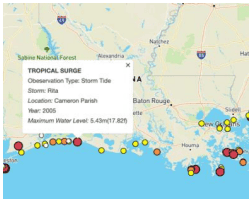
This page allows the user to view the peak recorded storm surge at a location of interest since 1880.
1. Zoom and pan to an area on the map. 2. Click a dot to view peak surge information. 3. The box describes the observation type, associated storm, location name, year, and the max water level recorded at that location.
Interactive Surge Map: https://surgedat.climate.lsu.edu/surge/
This tool provides a table of storm surge history and graphs of return periods, storm surge heights by year, and ranking of storm surge heights for a selected area.
1a. Search by Storm: Choose a storm and then year from the drop-down menus. 1b. Click an icon on the map to view the peak storm surge/tide at that gauge for the selected storm. A list of the peak storm surge/tide values for each gauge are in the table below the map. 2a. Search by Location: Enter a latitude (top box) and longitude (bottom box) if known and choose a distance from that point. If the coordinates are unknown, then first choose a distance from the drop-down menu, then click the map to select your desired location. 2b. Graphs on the right provide information about return periods with associated surge heights, surge heights by year, and a ranking of surge heights for the area within the red circle on the map. Return period graphs use the average values over the red circle area on the map. The table below shows the peak storm surge/tide value for each storm within the red circle area on the map and information of the gauge the peak was recorded at.
Historical Hurricane Tracks
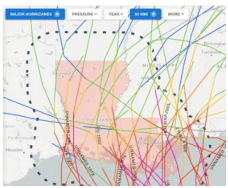
(1851-present) National Oceanic and Atmospheric AdministrationThis interactive tool allows users to explore past hurricanes. It provides detailed information on over 200 storms for Louisiana alone. It allows users to view information on the category, pressure, wind speed, and track and links to the official National Hurricane Center report on the tropical cyclone.
1. Type in location, year, or storm of interest (i.e., Louisiana) 2. A map will appear with the tropical storm tracks that match your search. 3. At the top left of the map, filter by category, sea level pressure, year, area, month, or ENSO cycle to narrow down storms. 4. Click on the storm track on the map or the event on the left menu to view detailed information on the event. 5. Click the PDF icon in the top right of the information box to view the official report on the storm (if available) or the “i” icon for more details.
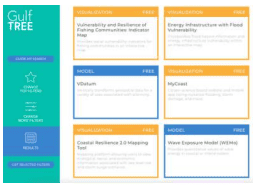
Gulf Tree
(Time frame varies by product) Northern Gulf of Mexico Sentinel Site Cooperative, Gulf of Mexico Climate Resilience Community of Practice, & Gulf of Mexico Alliance Resilience TeamThis decision support site guides users to the storm surge tools and resources they need along the Gulf Coast through several filters of information, including how much time and effort they are willing to spend on the tool.
1. Choose a Filtered Search to look through all filter categories on one page or choose Guide My Search to walk through questions step by step to achieve what you’re looking for. If you chose the Filtered Search, first choose the Geographic Scope. Click the Louisiana drop-down menu and choose Shoreline to select all coastal parishes or choose specific one(s). 2b. Under Tool Function, select what you’d like to use storm surge information for. You can leave this blank if you’re unsure which to choose. 2c. Under Cost, choose Free. 2d. Under Level of Effort, choose from low, moderate, or high (will determine how advanced the tool is). 2e. Under Climate Change Topics, select the drop-down for Flooding, then check the box for Storm Surge. Explore other drop-down menus in this section to add more filters for additional topics. 2f. Click View Tool Matches on the top right to go to the results page. Click any of the tools or resources to go to that site.
3a. If you chose Guide My Search, Gulf Tree will walk you through the same filters by asking 6 questions. For step 1 (Tool Function), check the box for why you need a storm surge tool, then click Submit. If you’re not sure which option to use, you can Skip this step. 3b. Step 2 (Topic Area) includes a filter for what aspect of the topic you’re interested in. Click the drop-down menu for Flooding and check the box for Storm Surge. Then, click Submit. 3c. On Step 3 (Location), click the Louisiana drop-down menu, then choose Shoreline to select all coastal parishes or choose specific one(s). Then, click Submit. 3d. For Step 4 (Level of Effort), choose how much effort you’d like to put into the tool, which will determine how advanced the tool is. Then, click Submit. 3e. For Step 5 (Tool Cost), choose Free, then click Submit. 3f. Click Leave Guided Search and View Matches to go to the results page or go back to a previous page on the left menu to change your selected options. Click any of the tools or resources to go to that site. 6. To create a new search, click Reset All Filters at the top right of the results page.
Climate Change Trends
While uncertainty exists in climate models, current research projects the overall frequency of hurricanes to decrease, but their intensity may increase (Easterling et al. 2017). Water temperatures in the Gulf have increased, fueling hurricanes and causing harm to coastal ecosystems (Carter et al. 2018). Furthermore, rapidly intensifying hurricanes have occurred more frequently in recent years and are projected to increase in the future, although this is an ongoing area of research with uncertainty (Bhatia et al. 2022; Emanuel 2017). This phenomenon and a growing population along the coast create an increased risk and exposure to this threat. Future sea level rise also exacerbates storm surge levels, allowing water to reach further inland than in the past. A 1-meter rise in sea level can cause a doubling of storm surge risk (Nielsen-Gammon et al. 2021). Read more about future hurricanes, tropical storms, and storm surge in Climate Change Science and Projection Resources.

