Lightning
Data Limitations
Historically, most lightning data have been proprietary, therefore, climatological records of the hazard are limited. However, a new NOAA satellite became operational in late 2017 and contains a significant technological advancement called the Geostationary Lightning Mapper (GLM). The GLM can detect the presence of total lightning including in-cloud, cloud-to-cloud, and cloud-to-ground. While this advancement will not provide historical lightning data, it will add to the climatological record as time goes on.
Definition and Description
A visible electrical discharge produced by a thunderstorm. The discharge may occur within or between clouds, between the cloud and air, between a cloud and the ground or between the ground and a cloud (NWS 2009).
Lightning forms from charge separation within thunderstorms, usually cumulonimbus clouds. Lightning is essentially a large spark of static electricity, similar to touching a doorknob on a dry day (although much more powerful). Most lightning forms from streamers that work their way down from the charge centers of clouds toward the ground. When it gets close to the ground, a return stroke is initiated, which we see as a flash of light. Thunder is created by a shock wave from rapid heating of the air to 18,000 degrees – hotter than the surface of the sun.
Lightning is capable of striking as far as 10 miles away from a storm. Distance can be estimated by counting the seconds between the flash and the sound of thunder. It takes 5 seconds for the shockwave to travel one mile. Lightning severity is not rated, although new detection systems allow accurate identification of lightning strikes allowing analysis of lightning frequency.
Historical Data
Lightning Climatology Tool
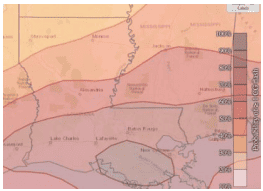
(1995-2019) NOAA/National Weather Service Storm Prediction CenterThis tool provides a daily and hourly lightning climatology and shows the probability of at least one cloud-to-ground (CG) lightning strike occurring each day of the year or each 1-hour or 4-hour period throughout the day. It can be used to assess the time of day and time of year with the highest probability of CG lightning. 1. Zoom in to your area of interest on the map. 2. The default map shows the daily (24-Hour) lightning probability on January 1, as indicated in the map title. To select a 1-Hour or 4-Hour climatology, hover your mouse over the Lightning tab at the top of the page and select 1-Hour or 4-Hour. To view other days or hours, move the horizontal scroll bar under the map. Note: the map title and scroll bar show hours in UTC format. 3. Click your area of interest on the map to view the probability of CG lightning occurring on that day or hour for that area. 4. Click the Time Series button within the pop-up box to view a graph of average CG lightning probability for your selected daily/hourly option. You can use this graph to quickly assess the time of year/day that location experiences the most CG lightning. Hover your mouse over the graph for details. Note for hourly options: the box shows local time, unlike the map title. The 4-hour graph will show the probability of at least one CG lightning strike occurring within a 4-hour window (e.g., the value for 12pm will show the probability of lightning occurring between 8am-12pm). 5. If you selected the 1-hour or 4-hour option, click the Heat Map button within the pop-up box to view a graph of 1-hour or 4-hour lightning climatology by both day of year (horizontal axis) and time of day (vertical axis). Darker colors represent a higher probability. Hover your mouse over the graph to assess what time of year and day that lightning is more likely to occur in your area.
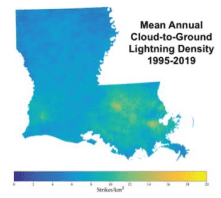
Annual and Monthly Distributions of Cloud-to-Ground Lightning
(1995-2019)NOAA National Severe Storms Laboratory / Cooperative Institute for Mesoscale Meteorological StudiesThese static maps show the cloud to ground lightning density (strikes per km2) in Louisiana, averaged over the years 1995-2019. There are five maps on the document that display annual and seasonal (winter, spring, summer, and fall) densities. 1. Click on the link below. 2. Annual and seasonal maps are displayed with a brief description.
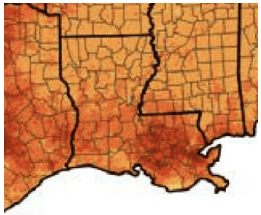
Vaisala Annual Lightning Report and Global Lightning Density Map
(Varies by year) VaisalaThis Annual Lightning Report page provides annual reports since 2017 that contain maps of average cloudto-ground flash density and total lightning density for the previous 5-10 years in the U.S. The reports also offer high-resolution local- and parish-level maps and information. Other features of this site are an archive of past annual reports, supplemental statistics, and a global lightning density map with parish-level data.
1. Click on the link to access Vaisala’s Annual Lightning Report page. 2. Scroll down to the Resources section and click the most recent Annual Lightning Report. 3. Scroll down the document to view various maps, such as total lightning density and cloud-to-ground flash density maps in high resolution and aggregated by parish. 4. To view average lightning density for each parish, click the Global lightning density map from the Annual Lightning Report homepage below Resources. 5. Zoom in until you see parish-level data. 6. Hover your mouse over a parish to view the total lightning density per km2/year from 2016-2021. Note: this map may be updated yearly, so check the About section on the left to confirm the time period.
Climate Change Trends
Studies have shown an increase in lightning associated with severe storms (Schultz et al. 2011). Climate models project an increase in the types of weather conditions that favor severe thunderstorms (Kossin et al. 2017), therefore, lightning occurrences could increase. Confidence in the projections is currently low, however, due to the isolated and sporadic nature of lightning events and limited comprehensive datasets, making it difficult to track long-term trends (Wuebbles et al. 2017a).