Cold Extremes
Data Limitations
Oklahoma generally has good quality long-term data records for cold temperature values, however, the consistency of cumulative years on record varies by station. The majority of stations consist of a large record dating back to the 19th century; however, some station locations include gaps in records that could be subject to technical issues or changes in monitoring location.
Definition and Description
A cold wave is generally characterized by a sharp and significant drop of air temperature near the surface (maximum, minimum, and daily average) over a large area and persisting below certain thresholds for a localized minimum number of days (WMO 2016).
Note: There is no universally-recognized metric for what constitutes a cold extreme. The World Meteorological Organization recommends characterizing a cold wave by its magnitude, duration, severity, and extent. Magnitude is defined as a temperature drop below certain threshold(s), either as an absolute value or percentiles. These values must be determined by the local climatology.
Cold extremes occur when polar and arctic air is displaced from polar regions toward the equator. The lack of sunlight in polar regions during winter allows the buildup of cold, dense air. Wiggles in the jet stream allow equator-ward (southward in the Northern Hemisphere) transport of cold air into the continental United States. High-amplitude jet-stream patterns (a series of large troughs and ridges in the upper atmosphere around the globe) allow air masses to move from their source regions.
Historical Data
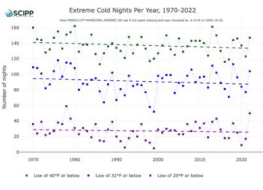
Temperature Trends Dashboard
(1970-2023)Southern Climate Impacts Planning ProgramThis tool shows temperature trends at individual stations across Oklahoma, including trends in extremely cold nights, seasonal extreme and average high/low temperatures, and heating degree days, since 1970.
1. At the top of the tool, click the Extreme Cold, Heating and Cooling Degree Days, Seasonal Averages, or Seasonal Extremes tab. 2. The default station is in Abilene, TX. To choose a station nearest to you, use the map on the right. Zoom in and click any of the blue dots to change stations. You can also select a station under the Station drop-down menu on the left of the page 3. Use the graph to determine the trend (if any) for your selection. Solid lines represent significant trends. 4. Mouse over individual data points to view more information. 5. For seasonal selections, make sure Winter is selected in the Season drop-down menu on the left of the screen.
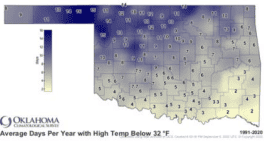
Highs and Lows Below 32°F
(1991-2020)Oklahoma Climatological SurveyThese static maps show the average number of days each year that the high and low temperature is less than 32°F. The maps can be used to understand the total number of days per year in which in which your area might experience high or low temperatures below freezing.
1. Scroll to the middle of the page. 2. Click on map of interest from the following: average number of days with highs below 32°F and average number of days with lows below 32°F.
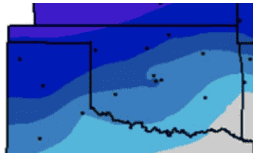
Wind Chill Days and Hours
(1973-2023) Midwest Regional Climate CenterThis set of maps depict the average number of days, day with 3 or more hours, and average number of hours per year with wind chill values at or below a variety of thresholds (e.g., 15°F, 0°F, -10°F).
1. Near the top of the page, click on the map link of interest out of the three options: Average Number of Days, Days with 3 or More Hours, or Average Number of Hours. 2. Right above the map, mouse over the wind chill temperature value of interest to view the corresponding data on the map. 3. To interpret the colors, see the legend on the top right side of the map. 4. To view more detailed information, such as station data, click the GIS Maps button on the top right of the page.
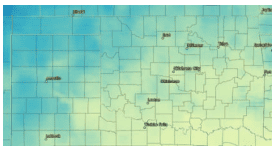
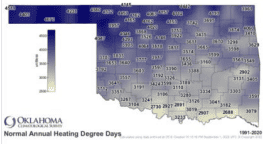
Average Annual Heating Degree Days
(1991-2020)Oklahoma Climatological SurveyThis static map shows the average annual heating degree days (HDD), a measurement used to quantify the demand for energy needed to heat buildings.
1. Scroll to the middle of the page. 2. Click on average annual heating degree days (HDD) link.
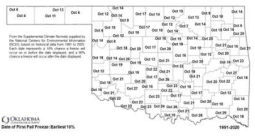
Freeze Dates
(1991-2020)Oklahoma Climatological SurveyThese static maps show the average dates of earliest first fall freeze, average first fall freeze, latest first fall freeze, earliest final spring freeze, average final spring freeze, and latest final spring freeze. Maps can be used to understand the times of the year in which you might experience temperatures below freezing for your area.
1. Scroll to middle of page to view the Fall and Spring Freeze Maps. 2. Click one of the six map options to view a larger map.
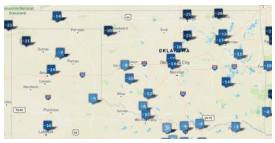
Record Low Temperatures
(Period of record varies by station; up to ~120 years)Southern Regional Climate CenterThis tool displays the lowest recorded temperature at individual stations.
1. Under Select a Product, select All-Time Records. 2. Under Select an Element, select Low Min Temperature. 3. Click Submit. 4. Temperature records are displayed on the map (pan, zoom in or out if needed). Mouse over a station to view its period of record and day on which the record occurred.
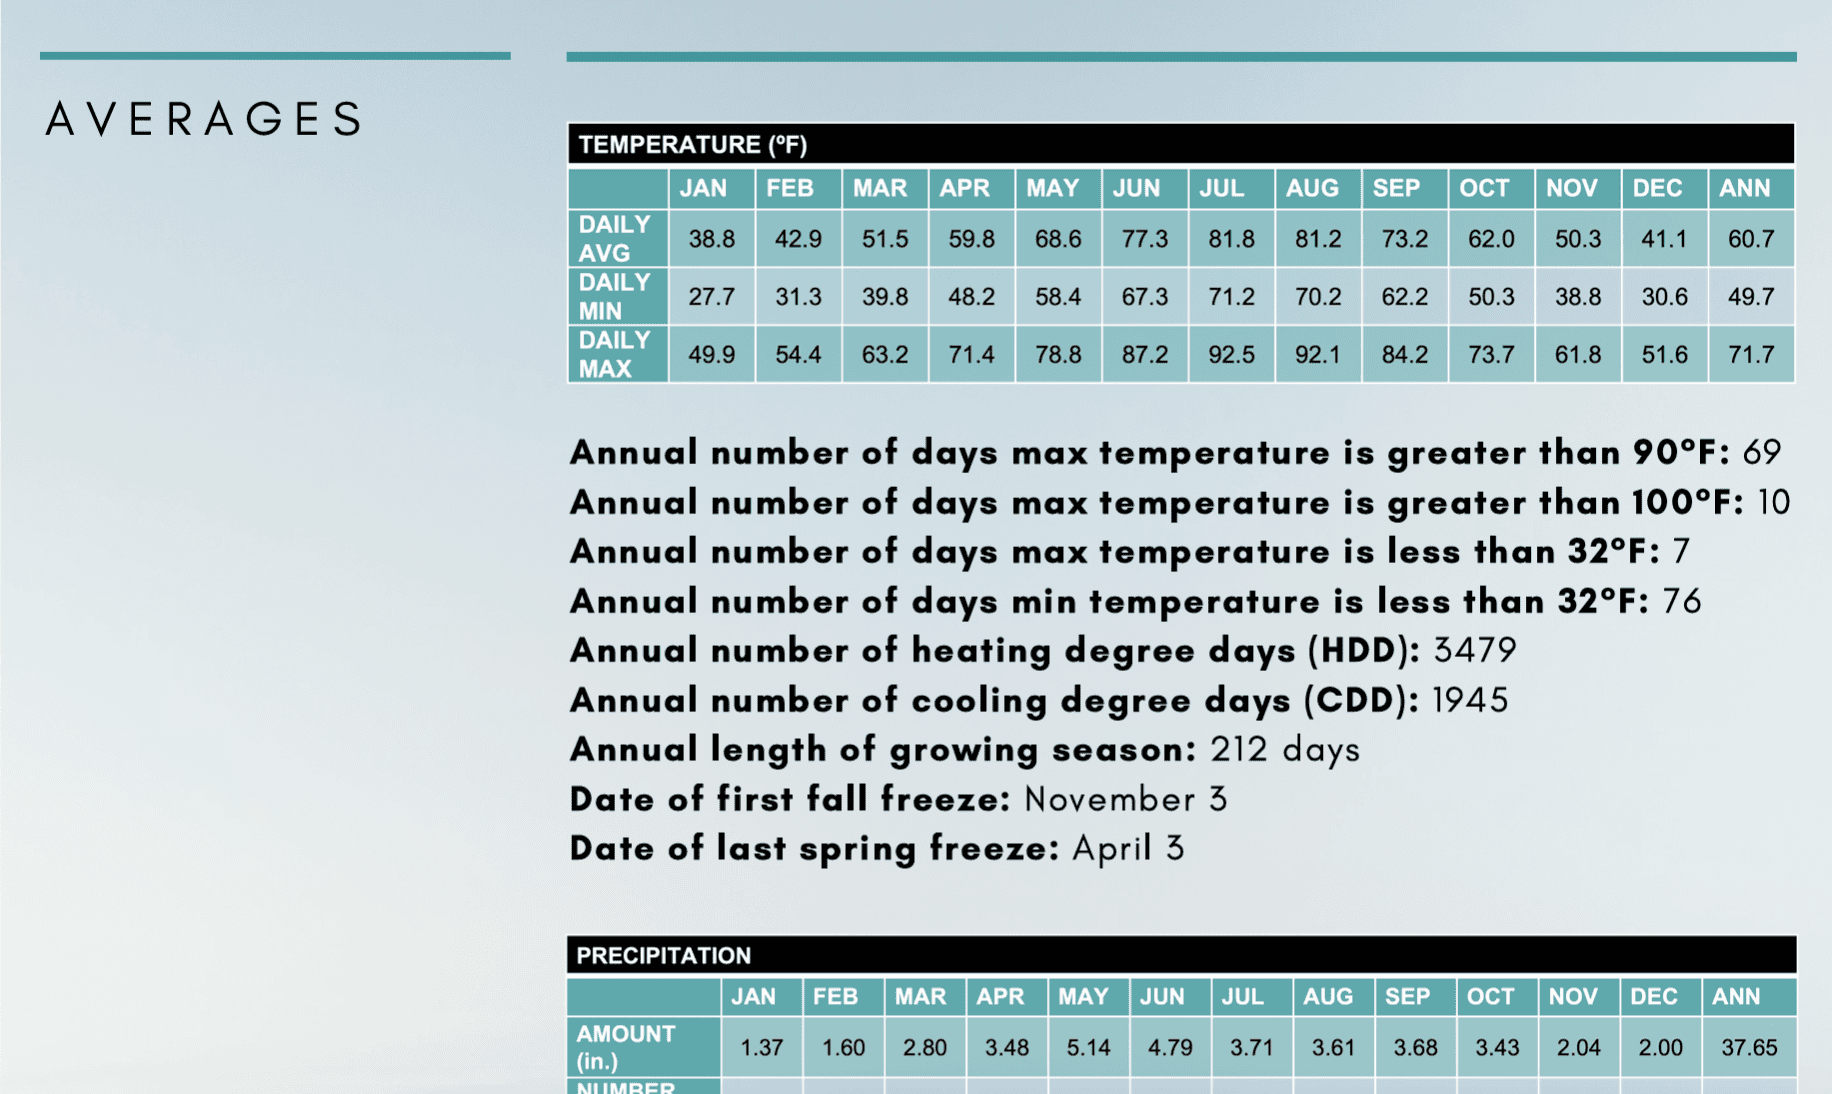
County Climate Summaries
(Period of record varies by county; up to ~120 years)Oklahoma Climatological SurveyThis site provides climate summaries for each county in Oklahoma. Browse the county-level documents for average and extreme climate statistics for multiple climate hazards, including extreme cold.
1. Click on a county of interest from the list. 2. In the Averages section, view the temperature table for the daily minimum temperature average by month or view additional statistics below. Statistics relevant to extreme cold include: average annual number of days maximum temperature is less than 32°F, annual number of days minimum temperature is less than 32°F, annual number of heating degree days, date of first fall freeze, and date of last spring freeze. 3. In the Records & Extremes section, view the record low temperature, earliest freeze date, and latest freeze date. This section also provides the date in which the record or extreme occurred. Note: Unless noted, average/normal values are based on the 1991-2020 period. Read the footnotes to take into account other methodologies.
Climate Change Trends
Oklahoma has consistently observed a below average number of very cold winter nights since 1990 (Frankson et al. 2022). Historically unprecedented winter warming is projected by the end of the 21st century under a higher emissions scenario. Extreme cold events will continue to impact Oklahoma; however, they will occur less frequently and with less intensity (Vose et al. 2017). Warmer winters signify that temperatures will remain warm for a longer amount of time, shortening the cold season which will subsequently lead to a longer frost-free period and growing season. By mid-century, models are projecting that Oklahoma will see 10 to 30 fewer days below 32˚F, with the greater reduction being across the northern two thirds of the state. Also, by mid-century, the coldest day of the year is projected to be 5˚F warmer and the most intense cold wave is projected to be 10˚F warmer (Vose et al. 2017). Read more about future cold extremes in Climate Change Science and Projection Resources.
Climate Explorer – Climate Maps and Graphs Tools
(1950-2099)NOAA Climate Program Office and National Environmental Modeling and Analysis CenterThe Climate Explorer is an interactive tool that allows you to view and compare the annual heating degree days and the average number of days per year with a maximum or minimum temperature below 32°F for the historical period and in the future under both higher and lower emissions scenarios.
1. Type in the city or county you are interested in. 2. Click Climate Maps. 3. Using the drop-down menu in the upper-left corner, select the variable of interest (Days w/ max temp <32°F, Days w/ min temp <32°F, or Heating Degree Days). 4. Next to the drop-down menu, select Map. 5. Use the middle slider on the map to compare averages between the historical period (1961-1990) and future decades (2020s-2090s) under lower and higher emissions scenarios. (Use the bottom drop-down menus to choose variables and the slider on the bottom right to choose a decade to compare with.) On the map, zoom in to the county level and click a county to view the associated values. 6. To view this information over time (1950-2099) for a single location, click the Graph tab at the top of the map and type a location at the top.