Earthquake
Data Limitations
Globally, scientific understanding of earthquake processes is somewhat limited, and the available history of seismicity is typically too short to establish reliable spatiotemporal patterns of large earthquake occurrences (Stein et al. 2012).
Definition and Description
A sudden slip on a fault, with resulting ground shaking and radiated seismic energy caused by the slip, or by volcanic or magmatic activity, or other sudden stress changes in the earth (USGS 2018).
Earthquakes occur from the sudden release of stress in the Earth’s crust. Stress is built up by the motion of tectonic plates. Stress may also be built up through the injection of fluids. During an earthquake, rocks on either side of a fault line move either horizontally or vertically. This movement creates three types of waves: Primary, Secondary, and Rayleigh waves. Primary waves spread outward from the epicenter (source of the fracture) as compression, like a spring. Secondary waves vibrate at right angles to the direction of travel; these are the most damaging. Rayleigh, or surface, waves move vertically, giving an undulating motion.
The Meers fault, located in southwest Oklahoma, has the potential for producing a strong earthquake. Additionally, Oklahoma experienced a substantial increase in light (M4.0-4.9) and Moderate (M5.0-5.9) earthquakes in recent years caused by wastewater injection from oil production, although the number of earthquakes declined beginning in 2016 as regulations were implemented. An earthquake caused by the New Madrid fault, situated in the Mississippi Valley, could also impact Oklahoma.
Earthquake intensity is measured on the Moment Magnitude Scale. Each point represents a 10-fold increase in the wave amplitude and a 32-times increase in energy release.
Historical Data
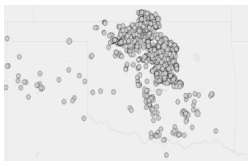
Earthquake Catalog
(Period of record varies by location; up to ~100 years) U.S. Geological SurveyShows past earthquakes on a zoomable map and can be used to show previous occurrences.
1. Under Basic Options, select the Magnitude, the Date and Time, and the Geographic Region to plot. Choose a Custom date and time with a start date such as “1900-01-01 00:00:00” to view long-term trends. You can select a Custom Geographic Region and draw a rectangle over Oklahoma by using the + button to zoom to the state. 2. Click Search. 3. A map with all earthquakes meeting your chosen criteria are shown and a list of earthquakes are on the left of the page. 4. View the map legend by clicking the key icon on the top right of the map area. To learn more about specific events, click any point on the map or select an event from the list. You can also sort by date or magnitude.
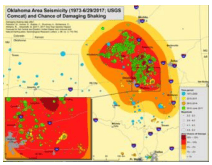
Oklahoma Area Seismicity Map, includes induced seismicity
(1950-2017) U.S. Geological SurveyShows the historical seismicity across the state (single points) along with the chance of damaging shaking in 2017 (contoured colors). Note: The 2017 Chance of Damage accounts for induced seismicity from wastewater disposal well injections associated with oil and gas plays. Can be used to help determine the risk of a damaging earthquake in your area.
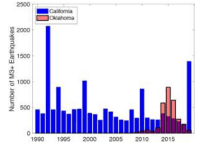
Oklahoma vs. California Earthquakes Bar Graph
(1990-2019) U.S. Geological SurveyShows the annual number of M3.0+ earthquakes in Oklahoma vs. California over time in a bar graph format. Can be used to show how the risk of earthquakes increased in the last decade.
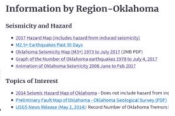
Oklahoma Earthquake Information Page
U.S. Geological SurveyAdditional information about earthquakes in Oklahoma. Click on links of interest.
Climate Change Trends
Prior to 2009, Oklahoma experienced 1-2 earthquakes per year that were magnitude 3.0 or greater. The rate of M3.0+ earthquakes increased to a peak of about 3 per day in 2015 concurrent with a statewide increase in wastewater injection into deep underground strata (Andrews and Holland 2015). As wastewater injection volumes have declined by over half, compared with 2015, the rate of M3.0+ earthquakes have decreased to less than 1 per day in late 2018. Thus, the future seismic hazard is interlinked with wastewater disposal well activity but will likely remain elevated, compared to background tectonic rates, for at least the next decade (OGS 2017). Note: this section of the Simple Planning Tool is titled ‘Climate Change Trends’, but in the case of earthquakes please regard this as future trends.