Tornado
Data Limitations
Tornado reports prior to around 1980 were compiled from written records. Consequently, many tornadoes may have gone unreported or multiple tornadoes may have been listed as a single track. Tornado tracking is unique as occurrences are recorded either by damage assessments or visual accounts (Kossin et al. 2017). Advanced radar technology, increases in population in rural areas, usage of video and social media, emphasis on documentation, and improvements in communication have resulted in an increase in the number of reports, especially among weaker (EF0-EF1) tornadoes. As these systematic biases are present, use caution when using long term trends as they are based solely on the number of reports.
Definition and Description
A violently rotating column of air, usually pendant to a cumulonimbus, with circulation reaching the ground. (NWS 2009)
Tornadoes generally form from severe thunderstorms, particularly supercell thunderstorms – those that are isolated with unimpeded inflow of moisture and enhanced by wind shear. Tornadoes may also form along squall lines or in bands of storms associated with hurricanes. Tornadoes require moist air, instability (warm air rising), a source of lift such as a front, dryline, or heating, and wind shear (change in wind direction and speed with height).
Tornadoes can occur at any time of the year in Oklahoma and at any time of the day, although they are most common in spring and summer and in late afternoon to early nighttime hours.
Tornado intensity is rated by the damage they produce, on a scale from EF0 (weak) to EF5 (violent). Strong (EF2-EF3) and Violent (EF4-EF5) tornadoes account for only about one-third of all tornadoes, but 97% of fatalities and the vast majority of economic impacts. Tornadoes along squall lines and hurricane bands are more likely to be weak, although widespread severe straight-line winds may accompany these types of storms.
Historical Data
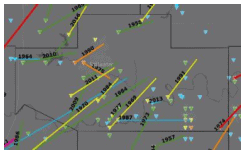
Tornado Tracks Tool
(1950-2023) Midwestern Regional Climate CenterThis is an interactive tool that shows historical tornado track details by track location or county. Consider nearby storm tracks, even if they did not hit your location, because small changes in storm motion can bring a tornado into your town.
1. Select area of interest either by zooming or entering a location into the search box. 2. Use panel on the left side of the screen to select variables of interest. Options include by Magnitude, Year Range, Month, and Casualties. 3. For more information, select either Track or County and click on area of interest on the map.
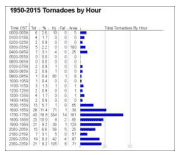
Tornado Risk Assessment
(1950-2019) NOAA/National Weather Service Storm Prediction CenterThis site is a series of graphs that shows tornado occurrences and statistics based on a given point. Statistics include F/EF scale frequency and probabilities of strikes occurring per month and time of day.
1. Click on the black bar at the top of the page (bar includes location, radius, and time period information) and provide zip code of interest. 2. Click Run. 3. Details about tornadoes that have occurred within selected area are displayed on the page.
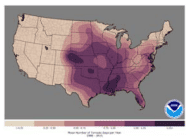
Tornado Days Maps
(1986-2015)NOAA/National Weather Service Storm Prediction CenterThese static maps show the average number of tornado days per year for all magnitudes (separate maps show EF1+, EF2+ and EF4+ days) within 25 miles of any point from 1986-2015. Tornado frequencies at a given location can be compared to nearby and regional locations.
1. Click on any of the four Tornado Climatology maps to view a larger image: All Tornado Days, EF1+, EF2+, or EF4+ Tornado Days.
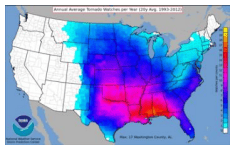
Tornado Watch Climatology Map
(2004-2023)NOAA/National Weather Service Storm Prediction CenterThis map shows you a 20-year climatology of tornado watches. From this map you can get a sense of the approximate number of days each year you can expect to have a tornado watch issued for your county(ies).
1. Under the Storm Prediction Center WCM Page banner near the top of the page, click on the Watch Frequency Maps link. 2. Scroll down a bit until you see 20y SPC Watch Climatology. 3. Click on Average number of tornado watches per year image to view it in larger form. 4. Note: This WCM page contains a lot of other statistics about the hail, severe thunderstorm, and tornado products that come out of the NWS Storm Prediction Center if you are interested in digging deeper into data.
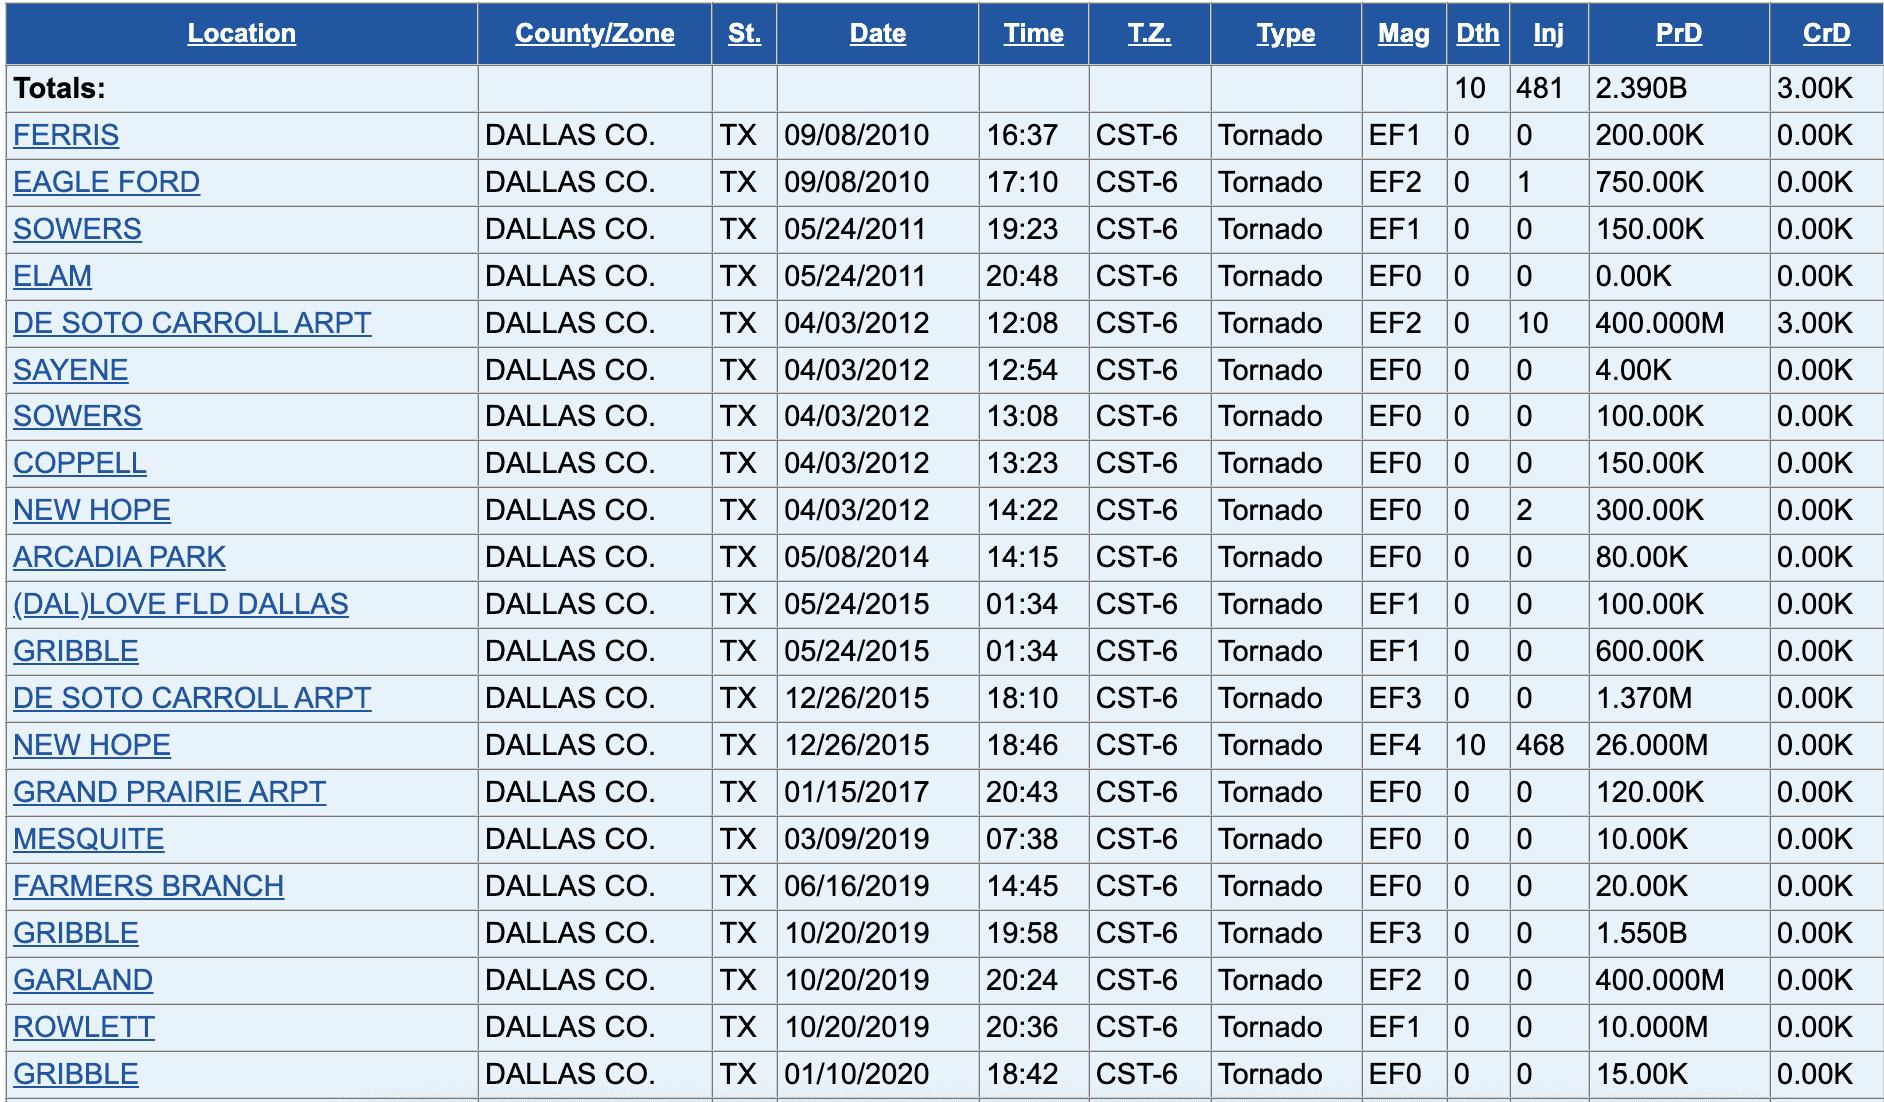
Storm Events Database
Tornado: (1950-present)NOAA National Centers for Environmental InformationThis interactive tool shows you the historical record for individual tornado reports by county. It can be used to determine tornadoes that have impacted your area or close to your area.
1. On the bottom left, under Select State or Area, choose Oklahoma → then Search. 2. From top to bottom, select a specific Begin and End Date, as well as County of interest. 3. Under Event Type(s), select Tornado. 4. Under Advanced Search and Filter Options → Tornado Filter, select tornado rating of interest or leave as All Tornadoes. 5. Press Search. Summary results are presented in a table. 6. Click each hyperlinked location name to view more information, read the storm narrative, and view the storm track. Note: This tool can be used to analyze a variety of additional hazards with various time periods, and tornado data goes as far back as 1950. Property and crop damage estimates are available in the table, but there are many limitations to this data.
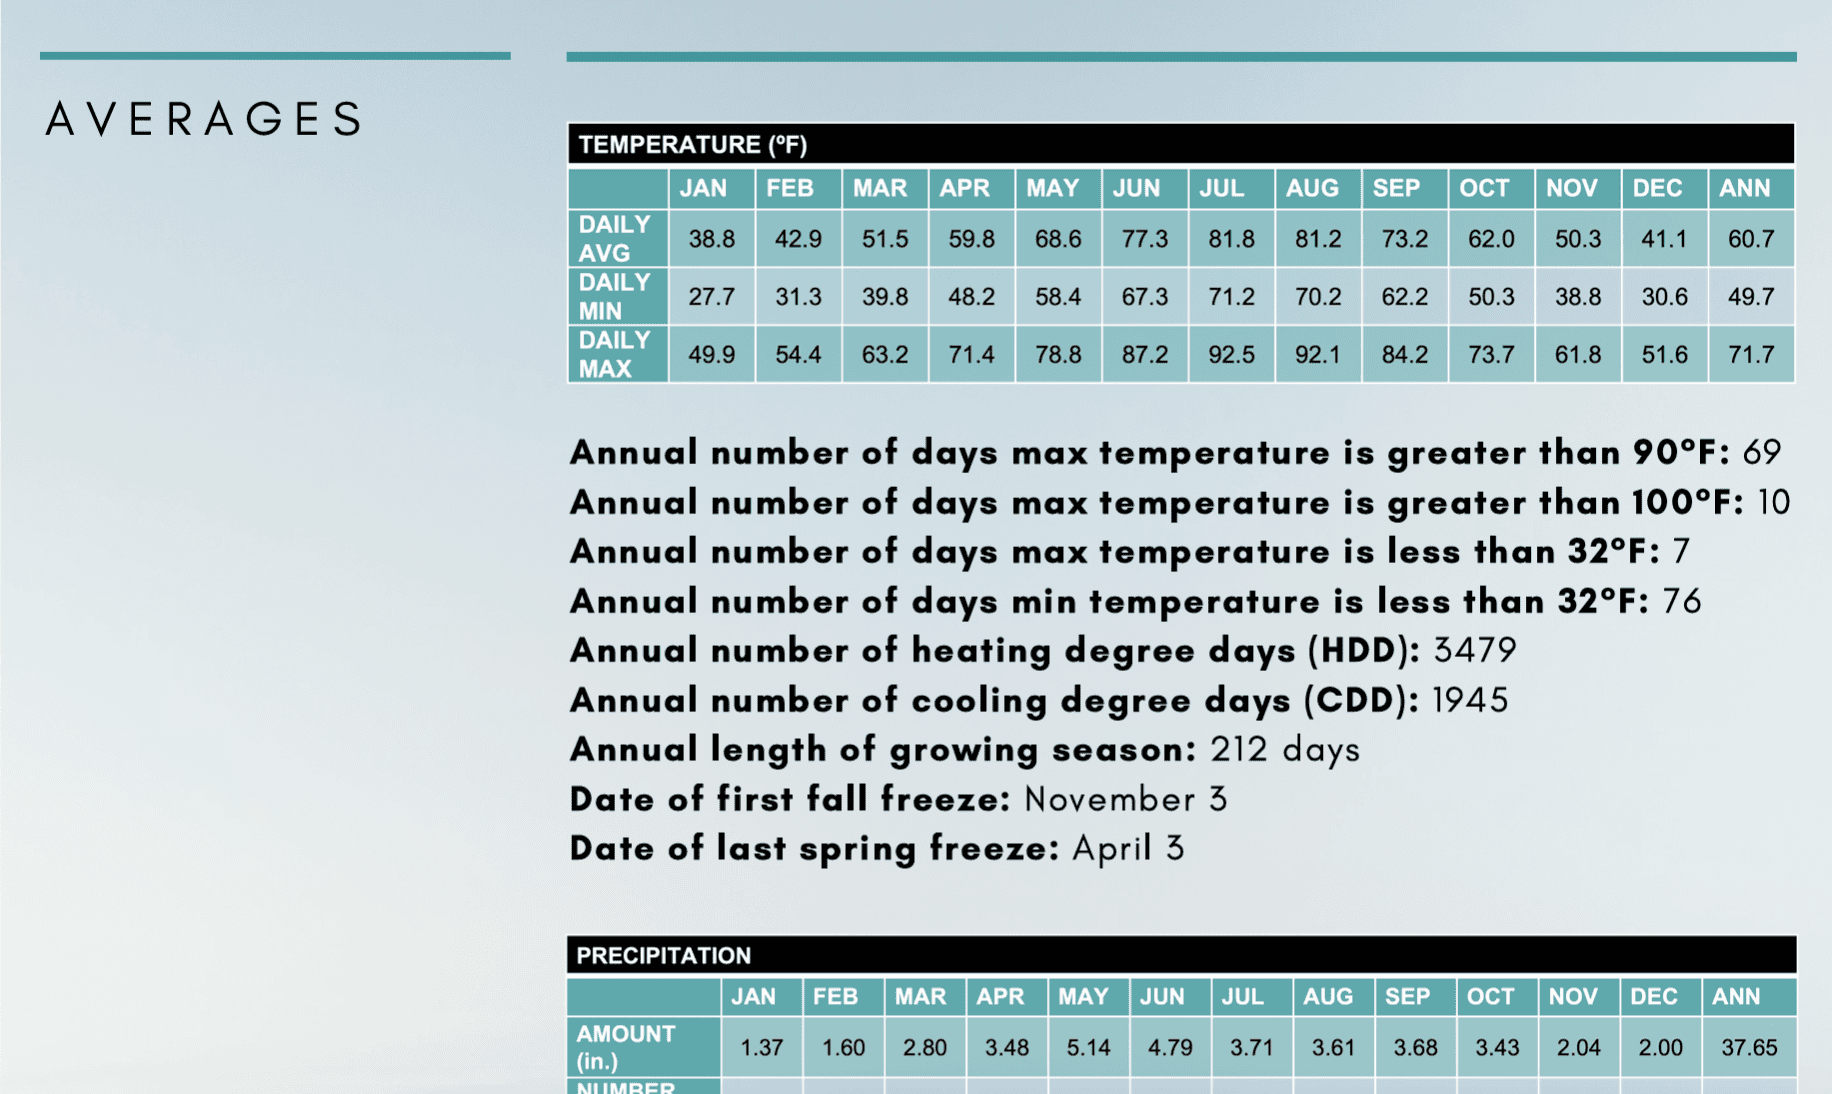
County Climate Summaries
Tornado: (1950-2021)Oklahoma Climatological SurveyThis site provides climate summaries for each county in Oklahoma. Browse the county-level documents for average and extreme climate statistics for multiple climate hazards, including tornadoes.
1. Click on a county of interest from the list. 2. In the Averages section below the precipitation table, view the average annual number of tornadoes and the total number of tornadoes from 1950-2021.
Climate Change Trends
Records over the past 40 years show that there has been an increase in the frequency of days with a large number of tornadoes (i.e. tornado outbreaks). However, there has also been a decrease in the frequency of days with tornadoes (Kossin et al. 2017). In other words, increasingly, when tornadoes occur, they are more likely to occur in conjunction with a tornado outbreak. It is currently difficult to account for tornadoes in climate models because they occur on a very small scale. Therefore, more rese arch is needed to understand how climate change is influencing tornadoes (Walsh et al. 2014). Progress has recently been made, however, in understanding how the large-scale climate system relates to the conditions that support tornadoes. As such, climate models project an increase in the frequency and intensity of severe thunderstorms, which can include tornadoes, most commonly during the months of March, April, and May. However, confidence in the details of this projected increase remains low (Kossin et al. 2017).