Earthquake
Data Limitations
Globally, scientific understanding of earthquake processes is somewhat limited, and the available history of seismicity is typically too short to establish reliable spatiotemporal patterns of large earthquake occurrences (Stein et al. 2012).
Definition and Description
A sudden slip on a fault, with resulting ground shaking and radiated seismic energy caused by the slip, or by volcanic or magmatic activity, or other sudden stress changes in the earth (USGS 2018).
Earthquakes occur from the sudden release of stress in the Earth’s crust. Stress is built up by the motion of tectonic plates. Stress may also be built up through the injection of fluids. During an earthquake, rocks on either side of a fault line move either horizontally or vertically. This movement creates three types of waves: primary, secondary and rayleigh waves. Primary waves spread outward from the epicenter (source of the fracture) as compression, like a spring. Secondary waves vibrate at right angles to the direction of travel, and these are the most damaging. Rayleigh, or surface, waves move vertically, giving an undulating motion. Earthquake intensity is measured on the Moment Magnitude Scale. Each point represents a 10-fold increase in the wave amplitude and a 32-times increase in energy release.
The Meers fault, located in southwest Oklahoma, has the potential for producing a strong earthquake that could affect Texas, usually in the Panhandle. Additionally, Texas experienced a substantial increase in light (M4.0-4.9) and moderate (M5.0-5.9) earthquakes in recent years caused by wastewater injection from oil production, many of which are experienced in West Texas. An earthquake caused by the New Madrid fault, situated in the Mississippi Valley, could also impact Texas.
Historical Data
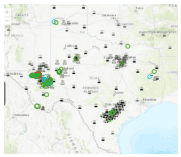
Earthquake Catalog
(Period of record varies by location; up to ~100 years) U.S. Geological SurveyThis tool shows past earthquakes on a zoomable map and can be used to show previous occurrences.
1. Under Basic Options, select the Magnitude, Date and Time, and Geographic Region to plot. Choose a Custom date and time with a start date such as “1970-01-01 00:00:00” to view long-term trends. Select a Custom Geographic Region for Texas by clicking Custom, then zooming into the pop-up map and drawing a rectangle around Texas. 2. Click Search. 3. A map with all earthquakes meeting your chosen criteria are shown and a list of earthquakes are on the left of the page. 4. View the map legend by clicking the key icon on the top right of the map area. To learn more about specific events, click any point on the map or select an event from the list. You can also sort by date or magnitude.

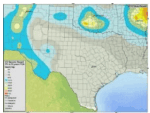
2014 Seismic Hazard Map - Texas
(1964-2014) U.S. Geological SurveyThis map shows the chance of damaging shaking (contoured colors). It can be used to help determine the risk of a damaging earthquake in your area.
TexNet Earthquake Catalogue
(2017-present) TexNet, Bureau of Economic Geology, UT AustinThis catalog includes an interactive map and tables that show various earthquake datasets for Texas.
1. Using the date range selectors on the left toolbar or the timeline at the bottom of the page, select the range of interest, then select the magnitude range. The legend of earthquake magnitude and station type is on the left. 2. Use the map to pan and zoom to the area of interest. 3. Click Show Table on the top of the page to view more details.
Texas Earthquake Information Page
U.S. Geological SurveyAdditional information about earthquakes in Texas can be found on this page. Click on links of interest.
Climate Change Trends
The rate of magnitude-3 or greater (M3+) earthquakes in Texas has increased by about 2 to 12 events per year since 2008, and the number of M3+ earthquakes has increased eightfold since 2017 (Douglas 2022). This can be partially attributed to wastewater injection and other human activity. Human-caused earthquakes in Texas will likely continue in the absence of increased restrictions on wastewater injection (Frohlich et al. 2016; Skoumal and Trugman 2021). Note: this section of the Simple Planning Tool is titled ‘Climate Change Trends’, but in the case of earthquakes please regard this as future trends.