Sea Level Rise
Data Limitations
The tide-gauge network is sparse, so there is a lack of tide data for many coastal communities and inconsistent periods of records for locations that do have gauges. Satellite measurements provide better coverage, but do not provide a long-term record. Therefore, it can be difficult to obtain local long-term trends. Sea level rise projections include uncertainties in the rate of ice sheet melting in Greenland and Antarctica, changes in the Gulf Stream and land motion, and future greenhouse gas emissions.
Definition and Description
Long-term increases in mean sea level, the arithmetic mean of hourly heights observed over some specified period (AMS 2020).
Sea level rise occurs due to a combination of melting glaciers and ice caps and from thermal expansion. A vast amount of water is stored in ice caps, primarily in Antarctica and Greenland, which accounts for 50 times the volume of water compared to all the available surface water in lakes, rivers, and seasonal ice and snow. As global temperatures warm, ice sheets are melted which add their water to the surface level of the oceans.
As the temperature of water warms, molecules push farther apart, known as thermal expansion. Thermal expansion creates as great a contribution to sea level rise as does melting ice sheets.
Over the past 100 years, global sea level has risen, on average, 4-8 inches. Half of this is due to thermal expansion and the other half from glacial melt. Sea level is projected to increase by at least 3-4 feet by the end of the 21st century. This is enough to move the shoreline inward by 1,000 feet on average and to inundate 7,800 square miles of North America.
Historical Data
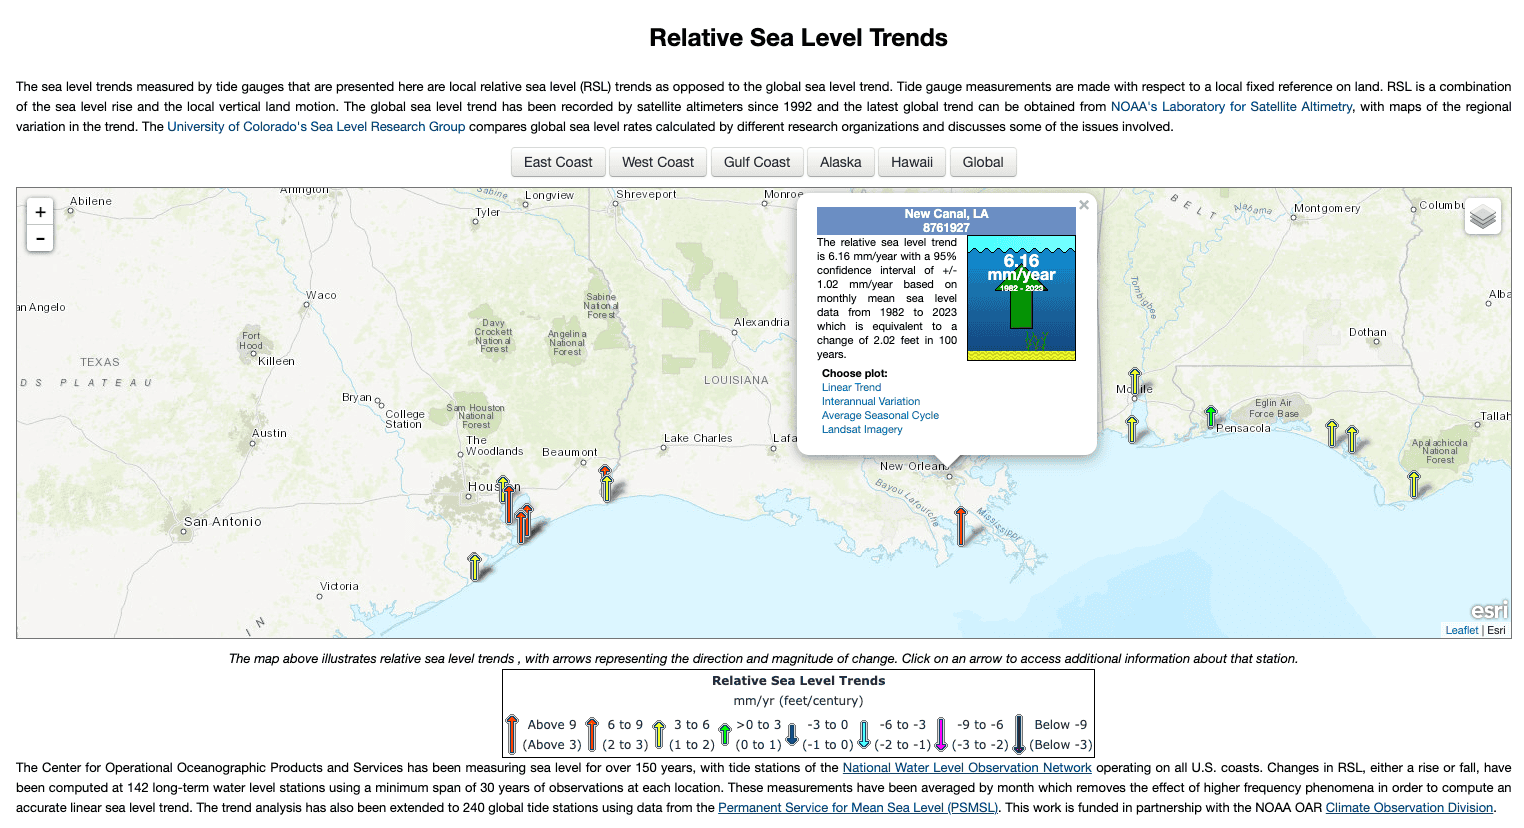
Relative Sea Level Trends
(Period of record varies by gauge; up to ~150+ years)NOAA Center for Operational Oceanographic Products and Services (CO-OPS)This tool uses historical tide gauge data to provide local relative sea level (RSL) trends, which takes into account sea level rise and local vertical land motion. It also provides a time lapse of satellite imagery via Google Earth to visualize the changing coast over time.
1. Click Gulf Coast above the map or pan and zoom to the Texas coast on the map. 2. Click a gauge location on the map, represented by an arrow. Note: use the legend under the map for a quick look at the trend for this location. Warmer colors and arrows pointing up represent an increasing trend. 3. A summary of the RSL trend is shown in the pop-up box. 4. Click Linear Trend in the box to view a graph of the RSL trend over time at this location. The summary of the trend information is included below the graph. You can export the data or save the image using the buttons under the graph. 5. To view a time lapse of satellite imagery via Google Maps, click Landsat Imagery from the pop-up box in Step 3. 6. This default image is zoomed into the selected gauge location. You can zoom in and out by using the +/- buttons on the top right of the page. You can also pause the time lapse and view individual years on the bottom of the page.
Gulf Tree
(Time frame varies by product) Northern Gulf of Mexico Sentinel Site Cooperative, Gulf of Mexico Climate Resilience Community of Practice, & Gulf of Mexico Alliance Resilience TeamThis decision support site guides users to the sea level rise tools and resources they need along the Gulf Coast through several filters of information, including how much time and effort they’re willing to spend on the tool.
1. Choose a Filtered Search to look through all filter categories on one page or choose Guide My Search to walk through questions step by step to achieve what you’re looking for. 2a. If you chose the Filtered Search, first navigate to Geographic Scope. Click the Texas drop-down menu and choose Shoreline to select all coastal counties or choose specific one(s). 2b. Under Tool Function, select what you’d like to use sea level rise information for. 2c. Under Cost, choose Free. 2d. Under Level of Effort, choose from low, moderate, or high (will determine how advanced the tool is). 2e. Under Climate Change Themes, select the box for Sea Level Rise. 2f. Under Climate Change Topics, select the drop-down for Flooding, then check the box for Sea Level Rise if you are interested in flooding associated with sea level rise. Explore other drop-down menus in this section to add more filters for additional topics. 2g. Click View Tool Matches on the top right to go to the results page. Click any of the tools or resources to go to that site.
3a. If you chose Guide My Search, Gulf Tree will walk you through the same filters by asking 6 questions. For step 1 (Tool Function), check the box for why you need a sea level rise tool, then click Submit. If you’re not sure which option to use, you can Skip this step. 3b. Step 2 (Topic Area) includes a filter for what aspect of the topic you’re interested in. Click the drop-down menu for Flooding and check the box for Sea Level Rise if you are interested in flooding associated with sea level rise. Then, click Submit. 3c. On Step 3 (Location), click the Texas drop-down menu, then choose Shoreline to select all coastal counties or choose specific one(s). Then, click Submit. 3d. For Step 4 (Level of Effort), choose how much effort you’d like to put into the tool, which will determine how advanced the tool is. Then, click Submit. 3e. For Step 5 (Tool Cost), choose Free, then click Submit. 3f. Click Leave Guided Search and View Matches to go to the results page or go back to a previous page on the left menu to change your selected options. Click any of the tools or resources to go to that site. 4. To create a new search, click Reset All Filters at the top right of the results page.
Climate Change Trends
Sea level on the Gulf Coast is projected to increase by 14-18 inches by 2050, which is more than the rise measured over the last 100 years (Sweet et al. 2022). Based on current emissions, 2 feet of sea level rise is expected along the U.S. coast between 2020-2100 (Sweet et al. 2022). Without reducing emissions, 3.5-7 feet of sea level rise may occur by 2100. The western Gulf Coast has the highest rates of sea level rise because of the high rates of subsidence. Sea level rise exacerbates coastal flooding and increases saltwater intrusion, which contaminates fresh groundwater supplies. Researchers are actively working to improve ice sheet dynamics and sea level rise modeling to further understand and enhance future projections. Read more about future sea level rise in Climate Change Science and Projection Resources.
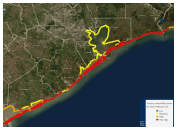
Coastal Change Hazards Portal
(Shoreline Change Forecasts: 50-100 years) U.S. Geological SurveyAccess this tool to view the Coastal Vulnerability Index and forecasted shoreline changes from sea level rise.
1. To view projections of vulnerability to sea level rise, zoom in to the area of interest 2. Select Sea-Level Rise from the righthand menu. 3. Select Coastal Vulnerability Index then the option for the Gulf of Mexico to view an area’s vulnerability to sea level rise. Or select Shoreline Change Forecasts → Probabilities of Shoreline Change for Contiguous U.S. then select one of the retreat/advance options (e.g., Probability of high shoreline retreat) to view the probability of future shoreline change over the next 50-100 years. Click the colored line on the map or refer to the legend to determine the risk value or long-term change at that location.
Sea Level Rise Viewer
(SLR: Present-2100, Local Scenarios: 2000- 2100)National Oceanic and Atmospheric AdministrationThis mapping tool visualizes impacts from sea level rise and includes local photo simulations of what future sea level rise may look like at select locations. The tool allows users to choose different water levels to view sea level rise projections, overlay community vulnerability, and view local scenarios by year.
1. Click Get Started. 2. Zoom into the area of interest. The default map is the current water level, where darker blues are greater water depths. 3. Adjust the vertical slider on the left to project different water levels. 4. To view a photo with simulated water levels, click an icon on the map (may need to zoom in). 5. Click Local Scenarios on the lefthand menu to view relative sea level rise by year and for different scenarios. Click any scenario icon on the map to change locations. 6. View by Scenario tab: Select a local scenario by sliding the scenario marker on the right to view the amount of relative sea level rise associated with that scenario in 20-year increments displayed on the left. View by Year tab: Select a year by sliding the year marker on the right to view the amount of relative sea level rise associated with that year for each of the local sea level rise scenarios on the left. 6. Click Vulnerability on the lefthand menu to overlay social and economic data to see the potential impact to sea level rise. Note: Access the legend by clicking the middle icon on the top right of the screen.