Wildfire
Data Limitations
A systematic, national collection of wildfire reports did not begin until the early 1990s. Many analyses are based on only a few years of data, which may not capture multi-year variability or trends. Further, fires accounted for by local jurisdictions may not always translate into national databases.
Definition and Description
Any free burning uncontainable wildland fire not prescribed for the area which consumes the natural fuels and spreads in response to its environment (NWS 2009).
Wildfires occur when weather conditions meet with sufficient fuel and an ignition source. Weather conditions include warm temperatures, low humidity, strong winds, and a period without precipitation allowing fuels to dry. Fuels are vegetation ranging from fine fuels such as grass and pine needles to large woody materials such as trees, dead and decaying logs, and organic material in the soil. Large woody materials are difficult to ignite. The presence of fine fuels allows fire to get started and become intense enough to ignite larger materials. Ignition sources may be natural, such as lightning, or human-caused, such as sparks from equipment, power transformers, a chain dragging behind a vehicle, or heat sources such as discarded cigarettes.
There are two wildfire “seasons” in Texas, although they can happen in any month. Fires are a common occurrence in late winter when dormant vegetation provides fine fuels and warm, windy, dry days provide weather conditions that allow ignition and spread. Summer has higher temperatures that can allow fires to become very intense, but there is typically less wind and consequently less spread. Fire spread may be increased on south-facing slopes, which are usually drier and warmer because of exposure to the sun, windy locations such as canyons, and along steep slopes. Very intense fires may become “crown fires” if they burn to the tops of trees, allowing embers to spread farther and create spot fires. Crown fires are almost impossible to extinguish without cooler, wetter weather conditions.
Fire danger is measured on a Burning Index scale, ranging from 0 to 110+. Values below 20 are considered low fire potential, 40-80 is high, and 110 or higher is extreme. The burning index combines potential energy release (fire intensity), flame length, and rate of spread. The National Weather Service issues Red Flag Warnings when weather conditions are favorable for ignition and spread of wildfires. Another popular index is the Keetch-Byrum Drought Index (KBDI) that considers weather and vegetation conditions. The scale ranges from 0 to 800, where values below 200 indicate high fuel moisture making ignition unlikely and values above 600 are indicative of intense wildfire conditions with any that develop capable of downwind spotting (starting new fires).
Historical Data
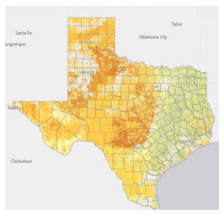
Texas Wildfire Risk Explorer
(Wildfire Ignitions: 2005-2021, Large Wildfires: 2005-2015)Texas A&M Forest ServiceThis interactive tool within the Texas Wildfire Risk Assessment Portal (TxWRAP) can be used to identify areas within Texas that are at greatest risk of wildfire and view historical wildfire occurrences. It is especially useful for identifying areas of risk in the wildland-urban interface and prioritizing areas where tactical analyses, community interaction, or mitigation treatments might be necessary to reduce risk. Note: Basic Viewer is accessible to anyone. Advanced Viewer is also free but requires account request.
1. Choose Basic or Advanced Viewer. Follow the upcoming instructions for the Basic option. 2. Pan and zoom in to the area of interest on the map. 3. Click on Map Themes in the upper left-hand corner. 4. Under the Wildfire Risk section on the left side of the screen, select the layer you want to view. Details about each layer can be found by hovering over the circular “i” icon. 5. To compare layers, such as WUI Response Index and Community Protection Zones, click on the icon to the right of the search icon on the top right of the map. You can choose two selections from drop-down menus. 6. View historical wildfire ignition locations and large wildfires in the Historical Fire Occurrence section. For wildfire ignitions, you can zoom in and click on a point to view information about that wildfire, such as date, acres burned, and cause of ignition. Note: Data are displayed at a very fine (25-meter) resolution, so you may need to greatly zoom in to view more details on the map. The Advanced version of this tool provides many more features, including the ability to upload your own shapefiles, download the map and associated GIS data for your area, generate a risk summary report for your area, and download an editable summary report to be used for Community Wildfire Protection Plan (CWPP) development.
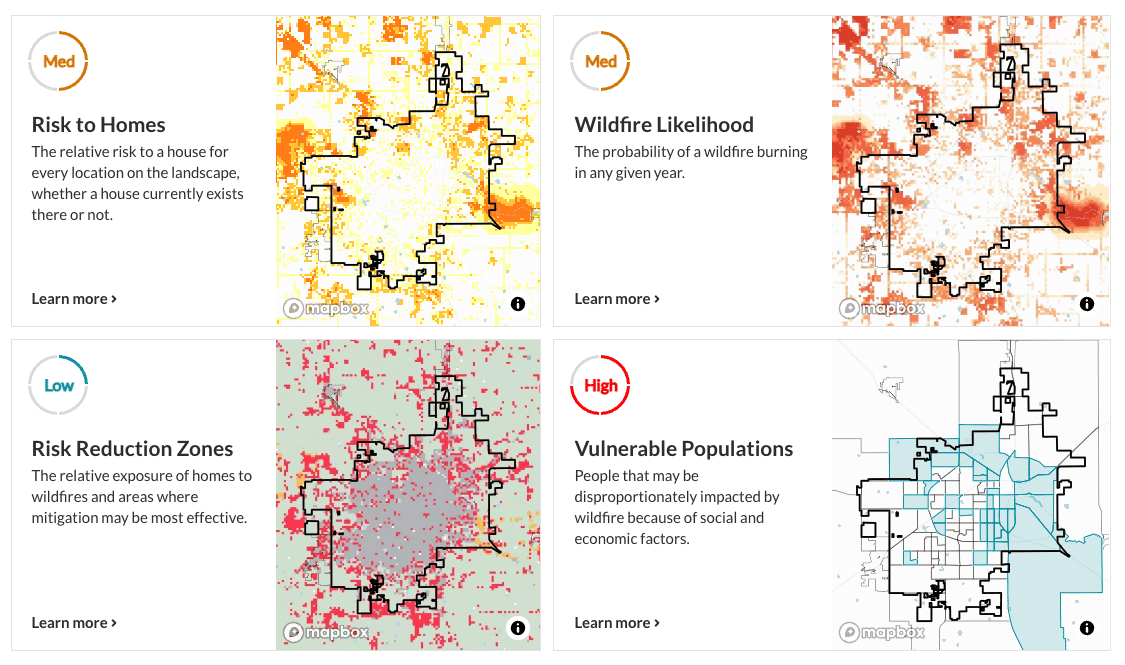
Wildfire Risk to Communities
(Varies by data layer; fire occurrence: 1992-2020, fuelscape: 2020)USDA Forest ServiceThis tool provides information and resources for communities to understand, explore, and reduce wildfire risk. Mitigation resources and programs for action are provided in the Incentive and Action Programs for Hazard Risk Reduction menu item, but this part of the tool allows users to explore risk for a community, tribal area, county, or state. This tool provides the risk to homes, wildfire likelihood, risk reduction zones, and vulnerable populations in the selected area, which are also compared to the rest of the state, county, or nation.
1. In the search bar, enter your desired community, tribal area, county, or state. 2. On the results page, you’ll see a summary statement comparing the selected area’s wildfire risk to the rest of the nation. Below this is a summary of the risk to homes, wildfire likelihood, risk reduction zone, and vulnerable populations, with a risk of low to high. 3. Select one of these risk tiles to view more information and access an interactive map. 4. The resulting page includes a summary statement, interactive map, descriptive information about that risk, and action information. 5. The Risk to Homes and Wildfire Likelihood options include an interactive graph of percentiles that compares your selected area to others. The default geographic comparison is Nation but you can select a different option (e.g., county or state) from the Compare to drop-down menu at the top of the page. Hover over the points on the graph to explore the information (red points represent higher risk or likelihood). Switch to other risk pages by using the tabs on the top of the page.
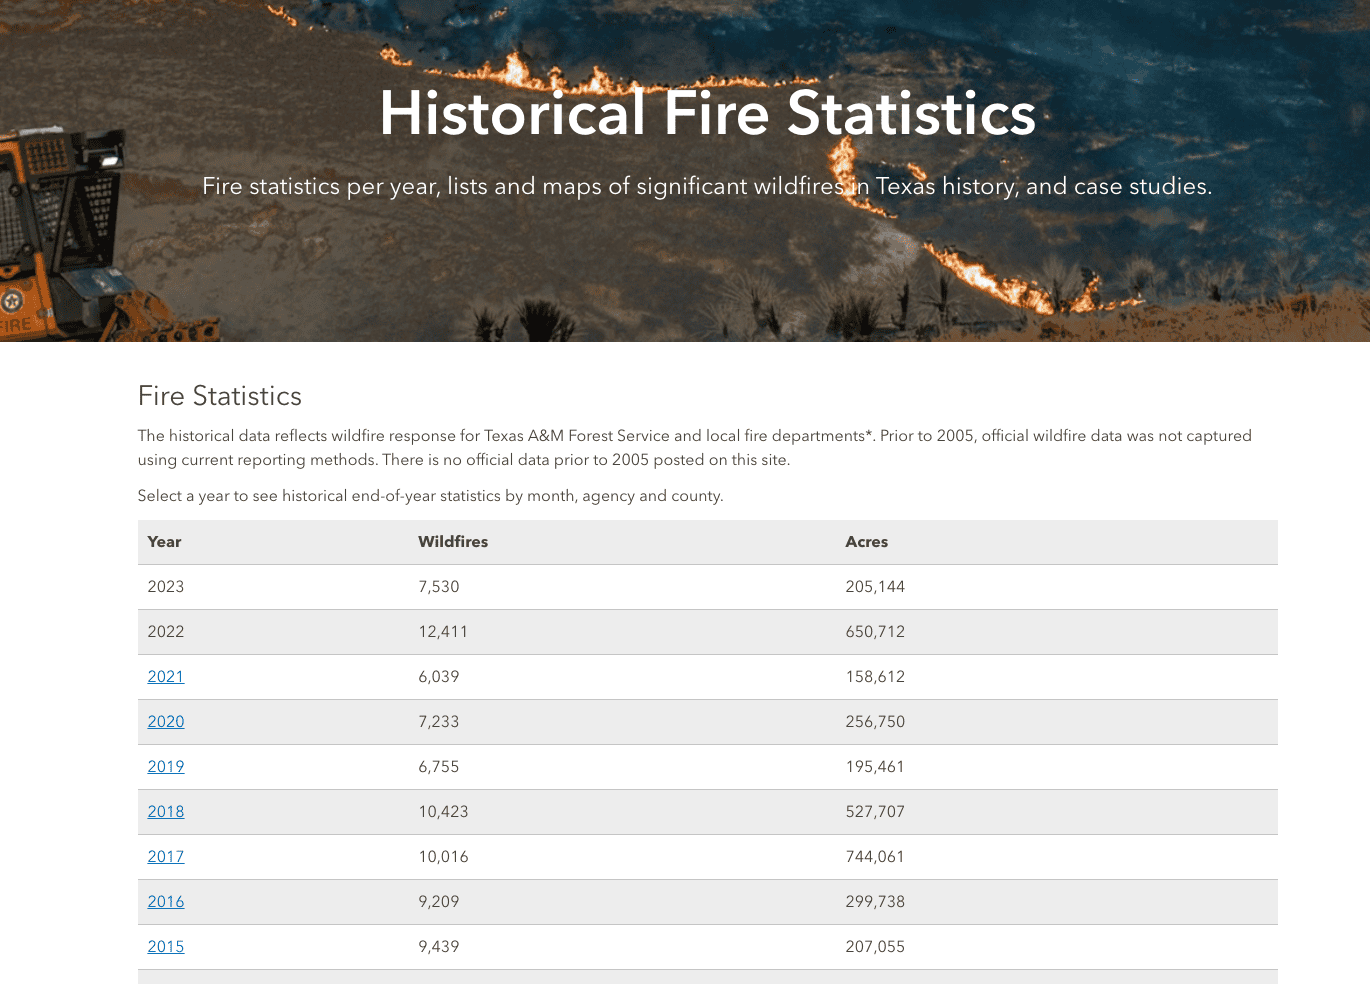
Historical Fire Statistics
(2005-present)Texas A&M Forest ServiceThis tool provides historical wildfire statistics for Texas, including annual reports of state- and county-level wildfire statistics (e.g., total fires, acres burned), lists of significant wildfires, and case studies.
1. Under Fire Statistics, view the state-wide total number of wildfires and acres burned by year in the table below. To view state-level statistics by month or annual county-level statistics for a year, click one of the hyperlinked years in the table to open the report. 2. Scroll down the page to view other significant wildfires in Texas history and case studies. Note: Most statistics and information include data starting in 2005, but the Largest Wildfires in Texas History has a longer period of record that isn’t listed.
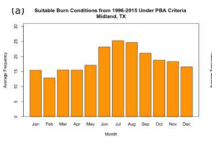
Prescribed Fire Climatology
(1996-2015)Southern Climate Impacts Planning ProgramThis document includes a series of static graphics and tables within a scientific report. It can be used to identify the best months to conduct prescribed burns as a wildfire management strategy. Coupled with tools such as TxWRAP, one can target locations and timing for safe burning along the wildland-urban interface. The report describes the average, minimum, and maximum number of days with a consecutive 4-hour period suitable for prescribed fire as a management tool to reduce vegetation fuel load and improve vegetation health.
Tables and Figures relevant to Texas: Tables 2, 9, and 10; Figures 9-22, Figures 27-49 in Appendix A-C, Figures 7-9 in Appendix D.
Wildland-Urban Interface
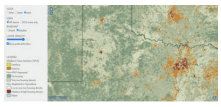
(1990, 2000, 2010, 2020) University of Wisconsin-Madison SILVIS LabThis interactive tool shows WUI (Wildland-Urban Interface) changes between 1990, 2000, and 2010 for locations of interest. It shows the effects of housing growth on the environment and which areas may need more local land management related to WUI issues.
1. Zoom in to the desired location on the map. 2. On the left side of the screen, select year, base map, and layer opacity of interest. Note: Texas-specific data and map files (down to the county level) are available by scrolling down the page.
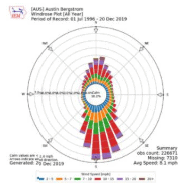
Wind Rose Plots
(Period of record varies by station; up to ~85 years) Iowa Environmental Mesonet, Iowa State UniversityView common and prominent wind speeds and directions for your area. Plots can be viewed by monthly average and by the long-term yearly average. This tool can be used to view the wind climatology and the predominant direction in which air pollutants flow. It may also be useful for understanding how wildfire events may evolve in a community.
1. In the Select By Network section, choose Texas ASOS then click Switch Network. 2. Select station of interest, either from the list or map, then click Select Station. 3. You will be brought to a new page. Near the top of the page, click on the Wind Roses tab. 4. The yearly climatology is displayed at the top of the page, and monthly climatologies are displayed below that. Click View Raw Data on any plot to view more details.
Climate Change Trends
Between 1984 and 2011, the number of large wildfires increased in Texas (Wehner et al. 2017). Wildfires in Texas are dependent upon current weather conditions, seasonal climate patterns, vegetation conditions, and an available source for ignition (such as a spark, flame, or intentional ignition). Given this complex relationship, the future trend for wildfire is also complex. Read more about future wildfire risk in Climate Change Science and Projection Resources.
Western TX: In western Texas and the Panhandle, an increase in dryness will decrease vegetation and provide less fuel for the fires (Nielsen-Gammon et al. 2021). While there’s a risk of wildfires increasing across the state, it may increase more slowly in western Texas.
Central TX: Some models show that central Texas is the transition zone in the changing fire regime with increased fire probability to the east (Stambaugh et al. 2018).
Eastern TX: In more vegetated, humid areas, like eastern Texas, wildfires may become more frequent with increased dryness of vegetation, and the wildfire season and the affected area is projected to expand (Nielsen-Gammon et al. 2021).