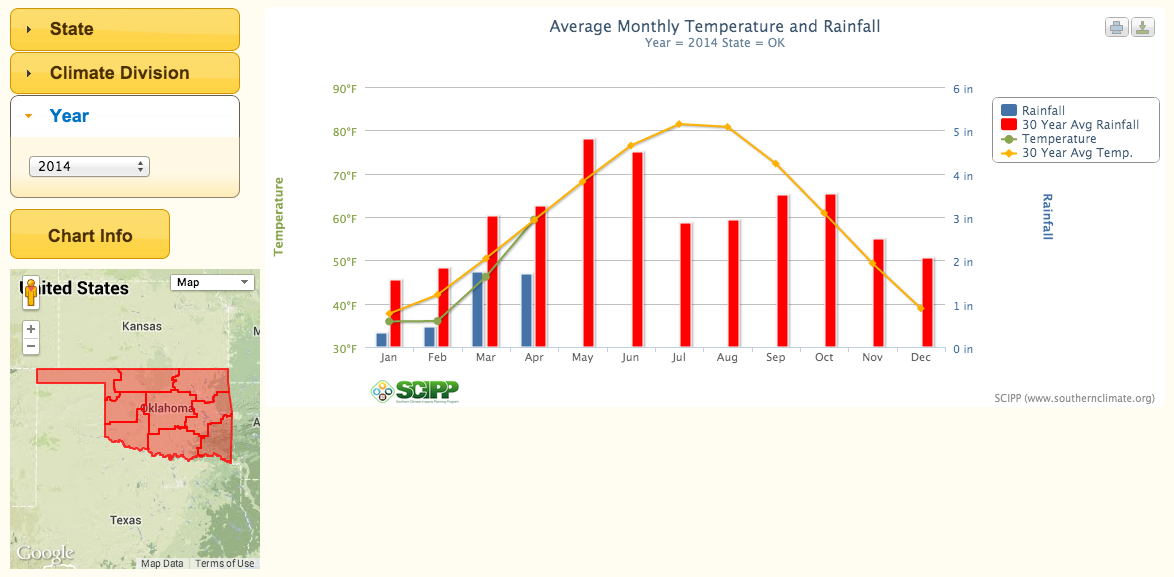
This tool displays information on how a particular year’s temperature or precipitation values compare to normal (i.e., 30-year average for the period 1991-2020). Users can view the information in a graph format by climate division for any state in the United States. A mouse-over function allows the user to view monthly values.