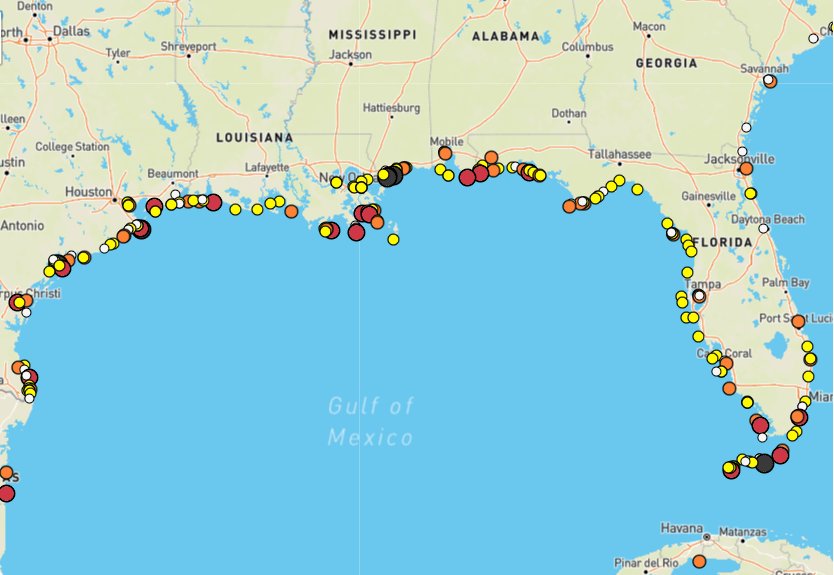
This tool provides an interactive global map with peak storm surge/storm tide for over 700 locations since 1880. Circles on the map represent unique storm surge events. Larger, darker circles represent higher magnitude events. When users click on a surge observation, a pop-up box indicates the storm name and year, as well as the location and height of peak storm surge.