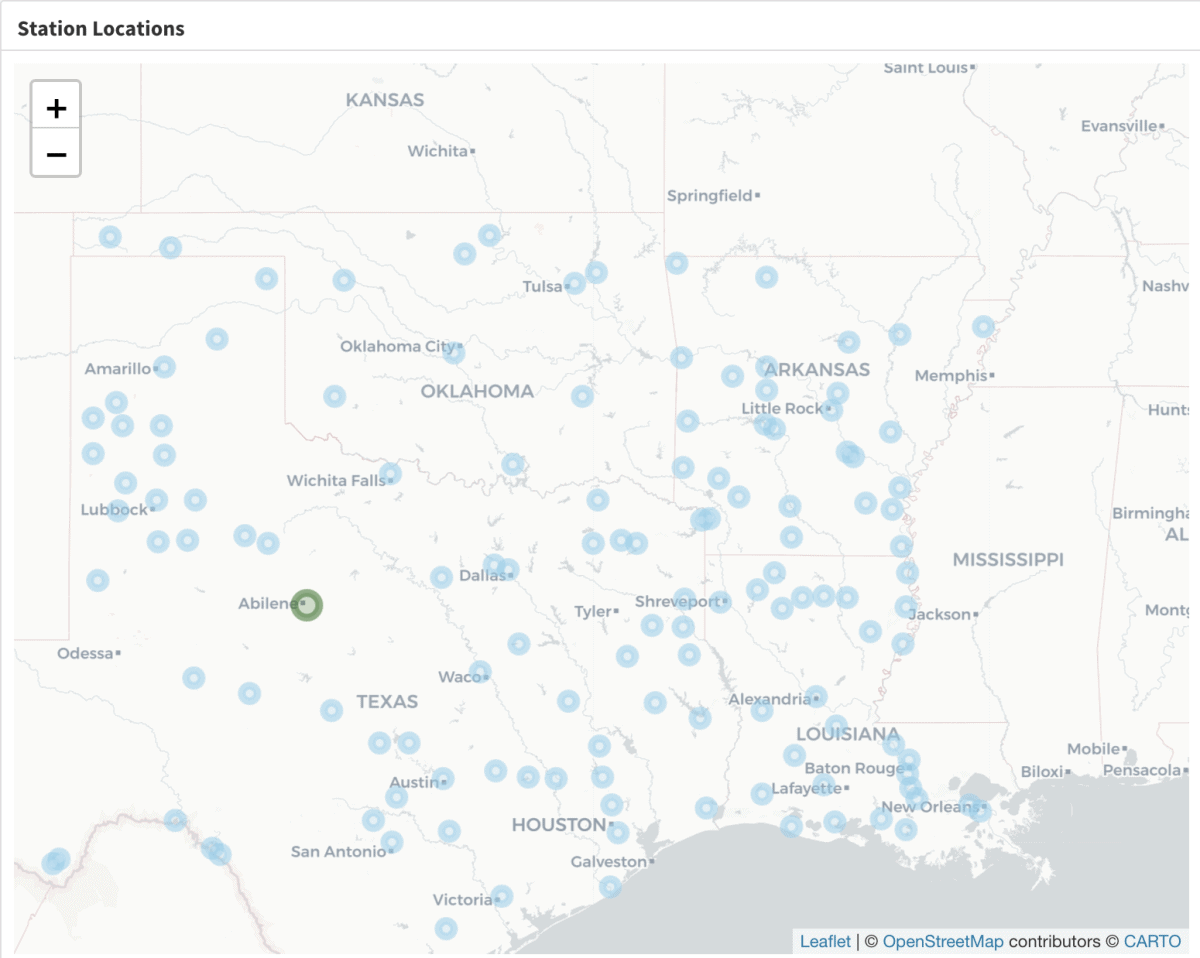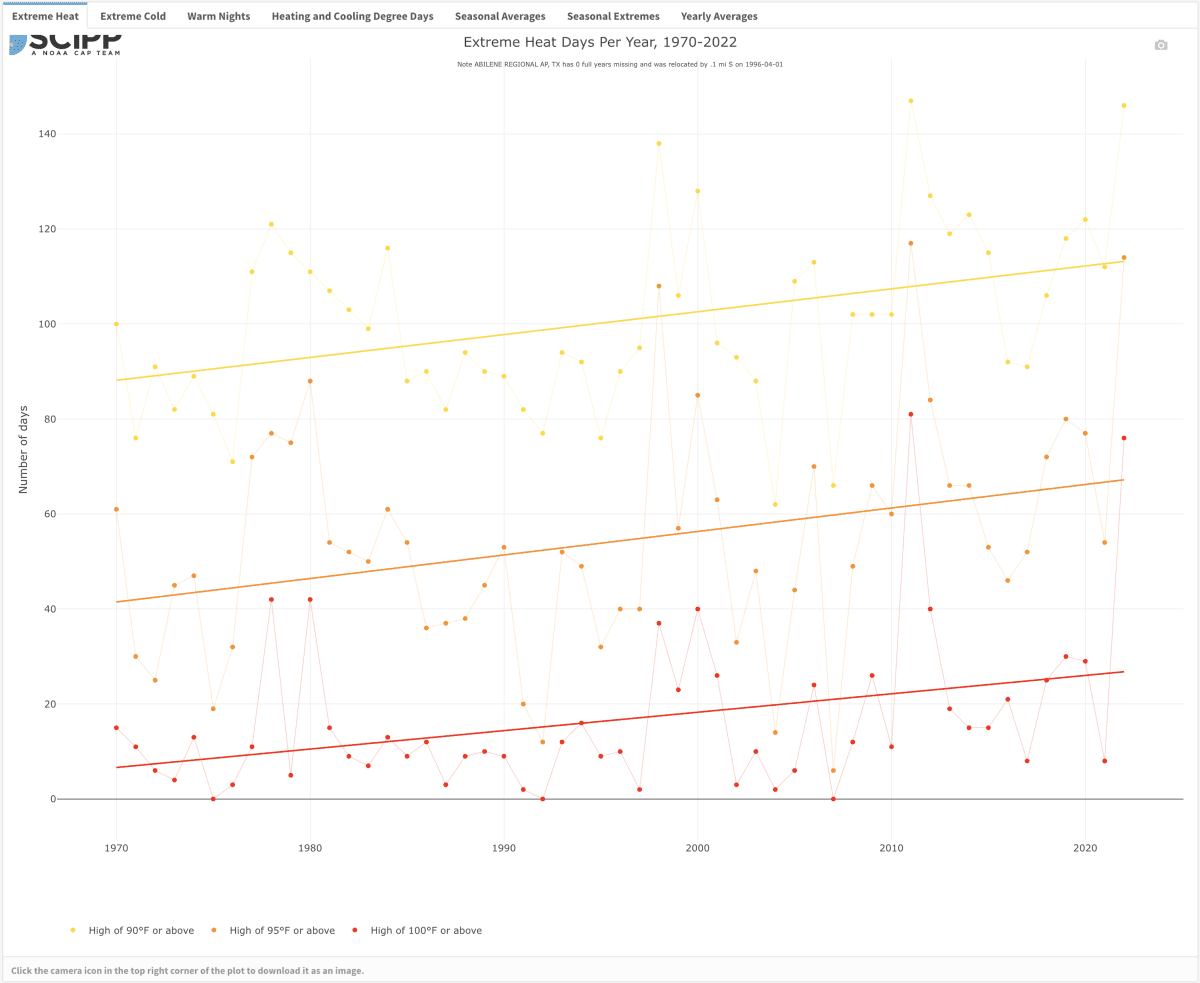
The Texas Temperature Trends Dashboard, now renamed the “SCIPP Temperature Trends Dashboard”, has been updated to include all states in the SCIPP region. The original 75 Texas stations have been expanded to include 27 stations in Arkansas, 28 stations from Louisiana, and 11 stations from Oklahoma. The database was also updated to include 2020-2022 temperatures, extending the trend period to 52 years (1970-2022).
While other resources exist that present regional or national trends in temperatures, few tools offer such information on a local level. This dashboard helps to fill that gap by providing location-specific information about changes in temperature in the last 52 years. By incorporating trends in indicators such as extreme heat and warm nights to data of overall temperature trends, the dashboard delivers insight into changes in heat that can have public health and economic ramifications on communities. Other indicators, such as heating and cooling degree days, are relevant to analyses of energy use and emissions.
With these updates, the tool finds new usability across the SCIPP region. Access the dashboard directly here or through the Data Tools page.